|
|||||
|
|
|||||
|
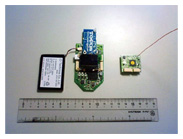
Feature Articles: Communication Science that Connects Information and Humans Vol. 10, No. 11, pp. 19–23, Nov. 2012. https://doi.org/10.53829/ntr201211fa4 Information Processing of Sensor NetworksAbstractIn this article, we introduce technologies for collecting information from many sensor nodes deployed in the environment and/or attached to people, interpreting the sensor data as meaningful information, and presenting it to people appropriately.  1. IntroductionIn our daily lives, we are surrounded by many sensors. For example, a video game machine uses an accelerometer as one of its input devices, and a mobile phone uses GPS (global positioning system) to determine the user’s location. In the field of weather forecasting, pressure, temperature, and other information about various places is collected in a network and utilized in creating a weather forecast. Although individual sensors are used in various situations, sensor networks are becoming easier to use as a result of sensor evolution and the spread of sensor network technology driven by progress in semiconductor technology. Sensor networks and their information processing technology are expected to be used for various purposes, such as collecting information to enable the provision of appropriate services that suit a particular situation and for recognizing the real world. 2. Research on sensor networksResearch on sensor networks is progressing with a focus on a sensor node equipped with various sensors, a calculation function (central processing unit (CPU), memory, etc.), wireless-communications functions, a battery, and networking capability. The sensor nodes that we have developed are shown in Fig. 1. Such research was triggered by the Smartdust project announced in 1999. In the Smartdust concept, the user deploys many sensor nodes, each of which consists of sensors, a battery, a digital signal processor, and a transmitter assembled into a cuboid with sides of about 1 mm to 2 mm, and observes environmental information collected from the sensor nodes. However, the need for miniaturization, which was initially advocated and dictated the sensor node’s size, is no longer considered to be such a high priority.
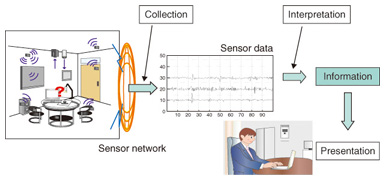
The flow of information on a sensor network is shown in Fig. 2. We assume that sensor nodes are deployed in the environment and/or attached to people. First of all, it is necessary to collect information efficiently from a lot of sensor nodes. Because the collected sensor data is the waveform of a time series, it is difficult for humans to understand the waveform’s meaning. So the next step is to interpret such time series information. When suitably interpreted meaning is presented to the user, the collected sensor data is finally being used effectively.
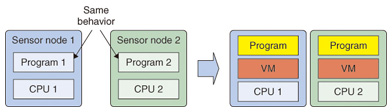
3. Virtual machine for wireless sensor nodeWhen many sensor nodes are used, it is important to reduce the cost of using them. In particular, in a network where two or more kinds of sensor (e.g., ones from different makers or with different CPUs) nodes are intermingled, the usage cost is high. To enable easy use in such situations as well, we have developed a virtual machine (VM) for a wireless sensor node. Usually, when users use various different sensor nodes, as shown on the left in Fig. 3, even when the same operation is carried out, another program needs to be prepared. But with the VM, even if the CPUs differ, the same program can be run on them.
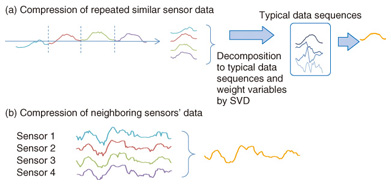
Our VM is based on CIL (Common Intermediate Language). Since CIL originated in Windows .NET, executable code can be created using the development environment of MS-Windows. Moreover, a sensor network’s manner of operation can be changed, even after sensor nodes have been deployed in the environment, because this VM has a function for wirelessly distributing created programs. 4. Sensor data collection from many sensor nodesIn order to collect information from many sensor nodes, analyze the situation in the real world from the sensor data, or create a sensor network that provides services according to a situation, it is necessary to collect data efficiently. Data compression technology based on the similarity of sensor data is shown in Fig. 4. Sensor data measuring the situation in the real world has the characteristics that there are periodic changes in the same sequence or changes in similar values obtained from neighboring sensors. Figure 4(a) shows the compression when sensor data from a single sensor node shows a similar value repeatedly. First, the sequence of sensor data repeated periodically is cut out. Then, the sensor data is decomposed into typical data sequences and weight variables by using singular value decomposition (SVD).
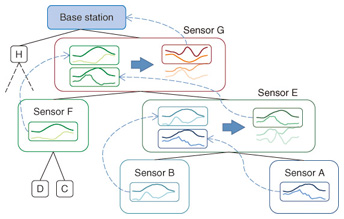
Weight variables express the importance for every typical data sequence, and the original sensor data can be restored by using these typical data sequences and weight variables. When information is transmitted from a sensor node, it is possible to compress the information by not transmitting all of the typical data sequences but transmitting only typical data sequences that make a high contribution. However, because not all of the information is sent, a certain amount of error occurs. An example of transmitting the data of neighboring sensors is shown in Fig. 4(b). Temperature may be data that shows similar values among neighboring sensors. This sensor data can be compressed by using the abovementioned method. The sensor data is transmitted to the base station while the sensor nodes are used as a hierarchical network (Fig. 5). After the data of sensor A and sensor B has been compressed and sent to sensor E, it is further sent to sensor G. Finally, the data is sent to a base station. Thus, it becomes possible to reduce the amount of information even further by applying the compression technique shown in Fig. 4 hierarchically. By reducing the data amount in the wireless communications, we can reduce the battery consumption, enabling the sensors to measure efficiently for a long time and collect more sensor information [1].
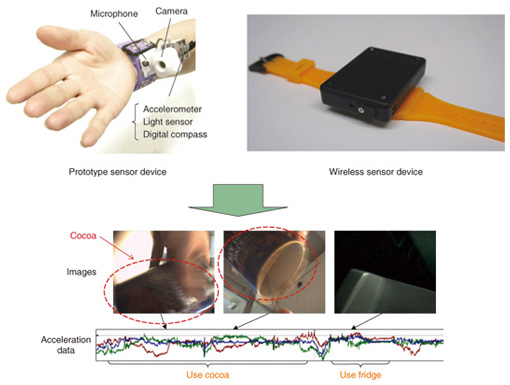
5. Interpretation of collected dataIf the information collected from the sensors can be interpreted and human activity can be inferred, this kind of technique lets us make applications such as ones for automatic lifelog creation, elderly care support, and home automation. We assume that almost all human activities are performed using the hands, so we developed technology to infer the kind of action being performed by using only a sensor device attached to a person’s wrist. Moreover, whereas previous methods can infer only simple human activities such as running and walking by using an accelerometer, our method can infer more complex activities with a comparatively high degree of abstraction, such as vacuuming and making cocoa. The wrist-worn sensor device consists of two or more kinds of sensors, for example, a camera, accelerometer, and microphone. The cameras acquire visual information about an object being manipulated, the accelerometer captures hand movements, and the microphones captures ambient sounds [2]. Prototype sensor devices and the information obtained from them are shown in Fig. 6.
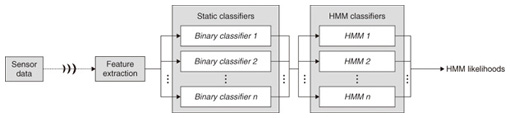
Human activity is inferred from sensor data by applying the machine learning technique. A system that can infer actions from sensor data is shown in Fig. 7. First, features are extracted from the sensor data. For example, in the case of a camera image, the raw image might be heavily blurred and privacy issues might arise depending on what other details are captured, including ones in reflections. In our system, these problems are avoided by using the picture’s color information for recognition. A histogram of the color contained in a picture is used as the feature. Other sensor data is also converted into corresponding features. Next, the extracted features are input to a classifier.
First, we prepare several binary classifiers—one for each activity that we want to identify—and the probabilities for all actions are output. For example, the data input from one binary classifier to the operation “making cocoa” judges the degree of agreement with the cocoa-making operation. Since 15 kinds of actions were identified in the experiment, 15 classifiers were used. Features were input in parallel with these classifiers. Next, they were input to a hidden Markov model (HMM) classifier, the time direction was inferred, and the output result of the binary classifier produced the final classification result. In the experiment, when all the sensors were used, activities were recognized with probabilities ranging from 80% to 90%. 6. Presentation of sensor dataCollected information or interpreted sensor information is eventually presented to a user. Research is being conducted on presenting information by automatically contributing information from sensors attached to objects to a weblog (blog). The presentation of such automatically contributed information can be made clearer and more natural by personifying the objects. Moreover, nowadays, microblogs and social networks like Twitter and Facebook are recognized as a basis for information distribution. For example, the sensor nodes described in section 4 will be able to tweet the current temperature. 7. ConclusionPeople can now be provided with various types of information by a system that collects information from many sensors and various kinds of sensor data and interprets it. However, at present, sensor information is not unified, so while helpful information can be offered to a user, many elements requiring further research and development still remain. Moreover, there is also the issue of personal information privacy and security in connection with information collection. From now on, research will move toward easy-to-use sensor network technology that is intelligible to people. References
|
|||||