 |
|||||
|
|
|||||
|
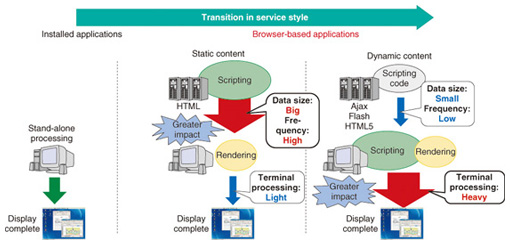
Feature Articles: QoE Estimation Technologies Vol. 11, No. 5, pp. 16–20, May 2013. https://doi.org/10.53829/ntr201305fa4 Performance Estimation Techniques for Browser-based ApplicationsAbstractCorporate application services using cloud computing are coming into wide use. These services include SaaS (Software as a Service), a delivery model for cloud-hosted software applications, and are provided via networks. Therefore, the state of the network and of the user terminal determines whether the performance assumed in the application development is achieved. This article describes methods we developed for estimating the waiting time experienced by the user and for determining whether or not a decrease in performance was caused by the user terminal. These methods make it possible to visualize application performance and to provide support when performance declines in browser-based applications, which are the main type of corporate application services. 1. IntroductionTraditionally, applications installed on terminals have been the mainstream, and applications with a web browser user interface started coming into wide use around the year 2000. Then web browsers gained the capability to serve as an application execution platform, which then led to the expanding use of technologies that enhance application interactivity, such as Ajax* or Flash in around 2007 (Fig. 1).
In conventional applications, web-browser-downloaded content such as HTML (hypertext markup language) and image files, is rendered and displayed in response to a user operation (hereafter referred to as static content). By contrast, in applications using technologies such as Ajax, the web browser first downloads executable code such as JavaScript and then executes the code in response to a user operation (hereafter referred to as dynamic content). With dynamic content, most of the processing is performed in the terminal, so application performance is less susceptible to network or server performance. However, it is strongly influenced by the terminal processing performance.
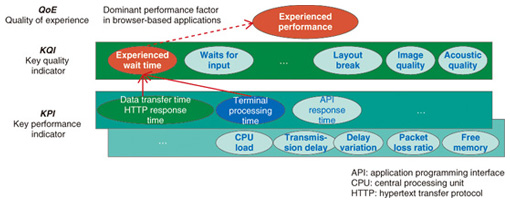
2. Performance indicators and problem with existing monitoring technology2.1 Application performance metricsVarious indicators can be used to measure browser-based application performance. We used an indicator that correlates to the user experience and is based on the timing from the start of a user operation until the time the results are displayed. We call this the experienced wait time. The layer model of browser-based application performance indicators is shown in Fig. 2. The experienced wait time corresponds to a key quality indicator (KQI), and KQI consists of various key performance indicators (KPIs) such as the data transfer time and the terminal processing time.
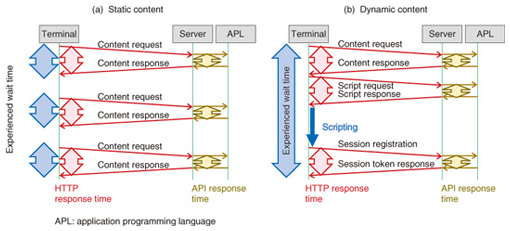
We describe here a specific example of the relationship between these indicators. A schematic representation of signals to be exchanged between the terminal and the server in browser-based applications is shown in Fig. 3. The left and right illustrations are respective examples for static and dynamic content. With static content, a hypertext transfer protocol (HTTP) signal is issued synchronously with user operation and data reception, so HTTP response time, a KPI, and experienced wait time, a KQI, are generally consistent. In the case of dynamic content, the HTTP signal is issued asynchronously with user operation and the processing performed only in the user terminal such as scripting, so HTTP response time and experienced wait time do not correlate in most cases [1].
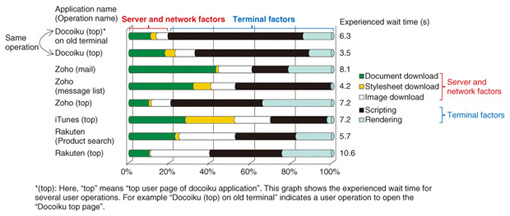
The percentage of processing time, in which the terminal is occupied, out of the total experienced wait time for some sample application operations is shown in Fig. 4. These results show that although there are differences between the operations, the terminal processing time is a key factor in the experienced wait time, and the experienced wait time varies greatly in different types of terminals even when the operation is the same (e.g., Fig. 4, docoiku old terminal and other terminal). These evaluations show that the terminal has become a key performance factor. Furthermore, existing indicators such as data transfer time (HTTP response time) and server response time (API response time) are not taken into consideration in the terminal processing factor, so it is not possible to grasp the experienced wait time from those indicators.
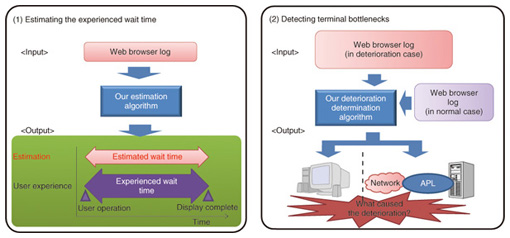
2.2 Performance monitoring problemMost existing performance monitoring products measure the HTTP response time and the API response time mentioned above. These performance indicators are suitable for evaluating network performance and server performance, but not for evaluating experienced wait time. This is because the aforementioned terminal processing time is the key factor in the experienced wait time, and it is not taken into account in those performance indicators. To address this problem, we developed a method to estimate the experienced wait time. This method is intended to close the gap that traditional performance indicators have in measuring the experienced wait time. We also developed a method to isolate the primary cause of deterioration. Our methods were developed for browser-based applications with dynamic content in order to (1) estimate the wait time experienced by the user and (2) determine whether or not a decrease in performance was caused by the terminal. 3. Introduction of our methodsAn overview of our methods is shown in Fig. 5. These methods are algorithms that take as input the web browser’s processing log data for networking, scripting, and rendering tasks; the output is the user experienced wait time. This information makes it possible to determine whether or not a decrease in performance was caused by the terminal for an operation of any application. More specifically, our algorithms calculate a feature amount from the web browser’s networking, scripting, and rendering logs, and output the estimated results by comparing the conditions of the expected user wait time feature amount pattern and the quality deterioration caused by the terminal feature amount pattern, which are prepared in advance.
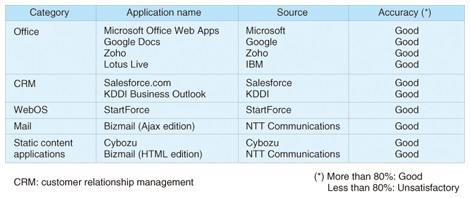
The applications that were evaluated are listed in Table 1. As indicated, our methods can be applied to widely used applications such as Salesforce and Microsoft Office Web Apps. To use our estimation methods, it is necessary to install the browser plug-in for the terminal targeted for estimation. This installation requires the user’s permission, so we applied the methods first to corporate applications.
4. Summary and future workWith the development of in-browser processing technology such as Ajax, the terminal processing time has become a key factor of the wait time that users experience. This has caused a gap between traditional performance indicators such as HTTP response time and API response time and the experienced wait time. We developed two methods for browser-based applications with dynamic content in order to deal with this problem. One method is used to estimate the wait time experienced by the user and the other to determine whether or not a decrease in performance was caused by the terminal. In the future, we plan to develop an estimation method that does not require a browser plug-in in order to extend our methods to mass users. Reference
|
|||||

