|
|||||||||||||||||||
|
|
|||||||||||||||||||
|
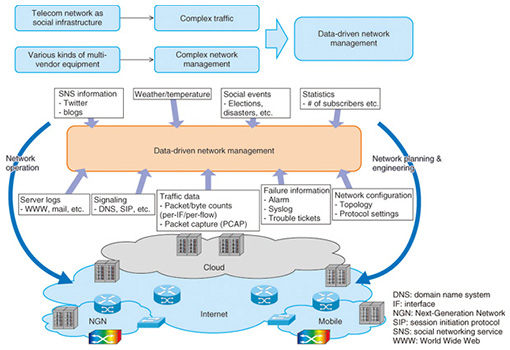
Feature Articles: Applications of Big Data Analytics Technologies for Traffic and Network Management Data Vol. 11, No. 11, pp. 12–17, Nov. 2013. https://doi.org/10.53829/ntr201311fa1 Applications of Big Data Analytics Technologies for Traffic and Network Management Data––Gaining Useful Insights from Big Data of Traffic and Network ManagementAbstractThe complexity of telecommunication networks continues to increase. Likewise, the complexity of traffic carried over these networks is also increasing. A data-driven approach is a promising technique for handling those complexities. We have been conducting research and development (R&D) on data analytics for traffic and network management by applying big data technologies. This article introduces the R&D activities involving applications of big-data analytics technologies for traffic and network management. Keywords: big data, traffic, network management  1. IntroductionBig data technology is attracting a great deal of attention, and many research and development (R&D) efforts related to it are under way around the world. These include R&D efforts on data warehouse products and large-scale distributed data processing platforms such as Hadoop, and those on data analytics technologies such as machine learning and data mining. By applying these big data technologies to traffic and network management, we expect to gain useful insights from a huge amount of operational data, which we could not have exploited before without such technologies, to improve traffic and network management processes such as network planning and engineering, and network operation. Telecommunication networks are becoming increasingly complex, and as the Internet becomes ubiquitous in its fundamental role as a social infrastructure, the complexity of traffic carried over the telecommunication networks is also increasing. We expect that a data-driven approach will be effective in handling those complexities. We have been conducting R&D efforts on data analytics for traffic and network management by applying big data technologies. This article introduces the R&D activities centering on applications of big data analytics technologies for traffic and network management. 2. Big data for network managementVarious kinds of data such as traffic measurement data, network configuration data, and data from network failure alarms are used in managing networks. By analyzing such data we obtain information that is useful for network planning and engineering, as well as for network operation (Fig. 1).
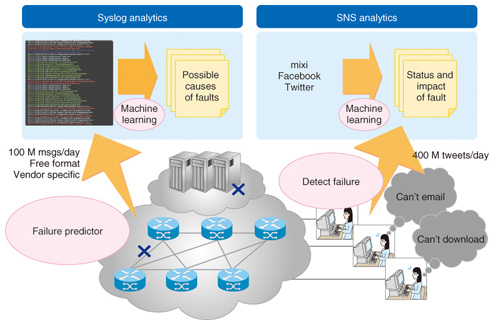
Traffic measurement data include packet count and byte count, which are measured and collected per link and per flow by the router as a management information base (MIB) and as Netflow data. We use more detailed information than MIB and Netflow to analyze traffic, which is becoming more and more complex. We capture and analyze all of the network data. Network configuration data include the connectivity between network elements such as routers, switches, and servers, as well as information on protocol settings. The connectivity between network elements is collected from a database of the network management system or from the configuration files of network elements. Protocol setting information is collected from the configuration files of network elements and captured protocol messages. Network failure alarms include alarm messages and log files of network elements and trouble tickets. Syslog messages are also exploited. These messages are unstructured and in free-text format, and are specific to each vendor. The original purpose of a syslog message is for debugging. The quantity of syslog messages generated from a network element can amount to thousands of lines per day. In addition to the above-mentioned data, big data generated from outside the network can also be used. Information from social networking services (SNSs) and blogs, and data that can be collected from the web can be used for network management. Additionary, statistics on the number of subscribers, and information on weather, temperature, and social events can be used for this purpose. 3. Value of big data analytics in network management3.1 Network planning and engineeringUnderstanding traffic characteristics is crucial for network planning and engineering. Telephone networks have a long history, and methods for managing them have been developed over a long period. As the Internet becomes ubiquitous in its role as a social infrastructure, various Internet applications have emerged, and the complexity of traffic carried over the telecommunication networks continues to increase. In particular, video traffic accounts for a large amount of the total traffic. It is therefore necessary to understand the details of video traffic to implement more effective network planning and engineering. Traffic characteristics will continue to change as new applications are developed and widely deployed. It is therefore crucial to continue measuring and analyzing traffic data. As stated previously, we can also benefit from other data such as statistics on subscriber numbers, weather, and temperature, as well as social event information, which affects the way telecommunications networks are used as a social infrastructure. 3.2 Network operationAs the role of telecommunication networks as a social infrastructure expands, outages of these networks have a huge impact. On the other hand, telecommunication networks are generally based on TCP/IP (transmission control protocol/Internet protocol). Various kinds of network elements such as switches, routers, and servers are deployed in telecommunication networks, and those network elements are manufactured by various manufacturers. Consequently, it is becoming more and more difficult to carry out troubleshooting when network failures and/or service outages occur. By analyzing big data on alarm information, log information, trouble tickets, and network configurations, we expect to be able to carry out troubleshooting tasks more quickly and easily. Syslog messages are unstructured and in free-text format, and are vendor-dependent. The quantity of syslog messages per day generated from networks could amount to tens of millions of lines in large networks that include tens of thousands of network elements. We expect to be able to extract useful insights from big data of syslog messages. We are also looking at big data from SNSs such as Twitter in order to extract information that will be useful for network troubleshooting. Twitter can be regarded as a medium for disseminating short real-time messages. We expect to be able to rapidly detect network service outages when they occur by analyzing the big data of tweets. The examples of using syslog and Twitter data are discussed in more detail in the next section. 4. Case studies of big data analytics in network managementHere, case studies of the use of big analytics in areas of network management such as network planning and engineering, and network operation are presented. 4.1 Case I: Network operation (failure prediction and detection)By analyzing a huge amount of unstructured data (syslog messages, SNS messages, etc.), we can develop methods of detecting failures that cannot be detected by existing network failure monitoring systems, as well as methods of analyzing the root causes of such failures. Machine learning is used to extract useful information for network operation (Fig. 2).
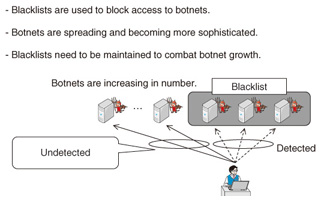
We are developing methods for analyzing syslog messages generated from network elements to find the root cause of failure and to detect predictive information for failures [1]. A machine learning algorithm automatically detects a set of simultaneously occurring syslog messages to understand the network event behind them. The method is applicable to syslog messages in unstructured and vendor-dependent formats. It helps to reduce the tedious tasks required in trouble-shooting by prioritizing and visualizing network events. We are also developing methods for analyzing Twitter messages (tweets) [1]. Twitter disseminates short messages in a real-time manner. We expect that we can quickly detect how customers feel about network service conditions by analyzing their tweets. We take an approach for supervised machine learning by collecting tweets that appeared at times when network outages occurred and also at times of normal network operation as training data. We form a classifier based on a support vector machine (SVM) by using training data. We employ the classifier in a real-time manner to detect the tweets associated with network service outages. We quickly detected customer opinions on network service outages by analyzing their tweets as well as by monitoring existing call center operations. 4.2 Case II: Network operation (security)Security is becoming a major concern in network operation areas. The use of botnets is spreading widely, which is threatening Internet security. Blacklists are used to contain the botnets. To prevent users from inadvertently accessing botnets, we use a blacklist of command and control (C&C) servers of the botnets and block the communication from users to those C&C servers. The botnets are sophisticated enough to expand their coverage by creating and spreading new C&C servers throughout the Internet. To cope with these ever-expanding botnets, we need to maintain and update the blacklists of the C&C servers (Fig. 3). We therefore analyze traffic data to improve our coverage of the blacklists.
We have developed a method to find new unknown C&C servers by exploiting the rule of thumb that a user’s personal computer (PC) that accesses a C&C server of a botnet and is consequently infected by malware, is likely to access other C&C servers as well [2]. We analyze traffic data and calculate the co-occurrence score between the server communicating with an infected server and the already-known C&C server communicating with the infected server. We assume that a server with a high co-occurrence score is a newly discovered C&C server. We expand the blacklist by registering the newly discovered C&C servers in the blacklist. An infected user PC is under the control of the C&C server. It can then be used to carry out security attacks such as DDOS (distributed denial-of-service) attacks, spam mail, and information theft. We analyze the communication patterns to find the ever-increasing C&C servers and block communications to them to contain the spreading botnets. 4.3 Case III: Network planning and engineeringThe Internet is becoming ubiquitous and is playing a fundamental role as a social infrastructure. Accordingly, numerous Internet applications have emerged, and the complexity of traffic carried over the telecommunication networks is increasing. In particular, video traffic accounts for a large amount of the total traffic. We therefore need a detailed understanding of video traffic to implement effective network planning and engineering. Video services are categorized as broadcast, VoD (video-on-demand), and OTT (over-the-top). These services have a large amount of content to meet customer needs. Customer behavior is quite different from that of traditional telephone networks. Analyzing customer behavior in their viewing of video services is crucial to understand video traffic. Thus, we take into consideration concurrent weather and temperature data and social event information to better understand video traffic [3]. We anticipate that customer behavior and their purpose in using telecommunication are constantly changing. In addition, when broadband service is provided by both wired and wireless access networks, it is crucial to understand the characteristics of customer demand for effective network planning and engineering. By analyzing the statistics on the number of subscribers of broadband services, we have developed a theory on S-shaped growth that enables more accurate forecasting of future traffic demands [4]. These days, the business structure between telecom network providers and telecom service providers is becoming more complex. Internet service providers (ISPs) and content service providers (CSPs) collaborate in delivering content to customers. The CSP employs a content delivery network (CDN) infrastructure for delivering content to customers using the network infrastructure provided by the ISP. The business objectives of the ISP and CSP are different. The ISP executes its operation including traffic control and network planning and engineering according to its own objectives. The CSP executes its operation including content delivery control and content allocation control according to its own objectives. It is crucial to understand their objectives and how they interact with each other in performing their operations when we execute network planning and engineering operations [5]. 5. Platforms for data analytics5.1 Platform for R&DWe are building a data analytics platform to collect, store, and analyze various kinds of traffic and network management data in order to conduct R&D efforts related to the application of big data analytics technologies for traffic and network management. We are using high-end commodity servers and a software framework for data-intensive distributed applications such as Hadoop to build our data analytics platform. We are developing algorithms for data analytics using high-end servers and we are making software tools that implement the data analytics algorithms we developed using machine learning, data-mining, and statistical analysis. The machine learning algorithms we are using to develop the data analytics algorithms include non-negative matrix factorization (NMF) [6], [7] and support vector machine (SVM) [8] to find hidden rules among big data and to make classifiers using training data. We are developing data analytics algorithms for unstructured data such as Twitter data and syslog data using natural language processing techniques including Japanese language morphological analysis and syntactic analysis techniques based on word-classification and clustering methods. We have implemented a real-time Twitter analytic tool using the online machine learning framework Jubatus [9] for pre-processing and an SVM type machine learning algorithm. Traffic is becoming more and more complex. We need to capture the entire data of packets and analyze them. The amount of data can be quite huge even for a short period. To cope with this, we use a software framework for data-intensive distributed applications such as Hadoop. We are implementing our algorithms using the MapReduce programming model for parallel processing of huge data. 5.2 Platform for data analyticsWe are conducting our R&D efforts by applying big-data analytics technologies to traffic and network management data. Real data is crucial for these R&D efforts. We collaborate with business units including network planning and engineering, and network operations in conducting R&D efforts. Traffic and network management data are measured and collected by the business units. We analyze those data in the R&D labs. We verify the analytic results through discussions with operators and engineers in the business units. We establish analytics methodologies through the above-mentioned R&D process and transfer them to the business units so that they can apply those methodologies in their operation processes. The R&D outcome, in the form of technical documents, operation manuals, and software tools and engines built into the operation systems, thus contributes to the business process innovations achieved in the business units. R&D efforts for big data analytics technologies require cross-domain expertise including database technologies such as Hadoop and data warehousing, and analytics technologies such as machine learning, data mining, and statistical analysis. We are collaborating on these technologies with other departments in NTT labs to conduct our R&D efforts. We expect that our data-driven approach using big data analytics technologies for traffic and network management data will continue to evolve and will contribute to producing a wide range of R&D outcomes. We will continue collaborating with our business units and other R&D departments to conduct our R&D efforts that exploit cutting-edge technologies developed in our R&D labs. References
|
|||||||||||||||||||