|
|||||||||||||||||
|
|
|||||||||||||||||
|
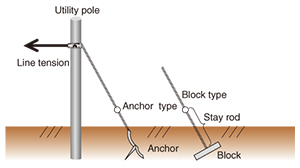
Feature Articles: Reducing the Environmental Burden of ICT Services Vol. 13, No. 3, pp. 17–22, Mar. 2015. https://doi.org/10.53829/ntr201503fa3 R&D on Conservation of Material Resources in Telecom FacilitiesAbstractNTT Energy and Environment Systems Laboratories has been focusing on the material resources used in constructing telecom facilities and is pushing forward with research and development (R&D) of green infrastructure technology for conserving resources in the design of new facilities in order to achieve a long service life, extend the service life of existing facilities, and renovate old facilities. This article presents a technology for diagnosing and evaluating degradation of buried stay rods and anchors to extend the service life of existing facilities, and a resource visualization technology that is relevant to recycling of resources when discarding facilities. Keywords: telecom facilities, material resources, resource conservation  1. IntroductionThe NTT Group telecom line facilities that support information and communication technology (ICT) services include about 700,000 km of optical cable, about 1.1 million km of metal cable, about 12 million utility poles, and about 620,000 km of conduit. It is thus important for the NTT Group to move forward with resource conservation while maintaining the safety and security of such a huge amount of infrastructure. Resource conservation is often discussed in terms of 3R technologies: reduce, reuse, and recycle. In reducing materials used for deployed facilities, it is important to extend the service life of existing facilities as well as to design future facilities with resource efficiency considerations. For that purpose, proper methods of diagnosing and evaluating degradation in existing facilities are essential. In this article, we first describe a technology for diagnosing and evaluating degradation in the buried stay rods and anchors of utility poles. We then describe resource visualization technology that contributes to improving recycling through clarification of the amounts and types of resources contained in discarded telecom equipment. 2. Technologies for evaluating degradation of buried stay rods and anchorsUtility poles are supported by a strand wire that is connected to a stay rod and secured underground by either a block (block type) or an anchor (anchor type) (Fig. 1). The stay rods are treated with hot-dip galvanization, and in order to prevent further corrosion, they have been coated with polymer (coatings) since 1988. About one-third of all blocks and anchors (about 2.5 million) produced under the old specifications prior to 1988 are still in use and are subject to a high failure rate due to corrosion in soil. The need for renovation of such facilities depends on the degree of degradation, so the criterion for renovation of the rod is set such that renovation is required before the cross-section of the rod is reduced by 50%, which corresponds to a safety factor of 1 (compared to a safety factor of 2 for new products). However, although the above-ground portion of the rod can be inspected visually, there is currently no means of directly checking the underground part without excavating the rod. There is therefore a need to develop an evaluation technology that does not require excavation of the rod to determine if there is thinning or a defect in the underground part that poses a risk of fracture. A method that uses ultrasonic guided waves to detect degradation in the underground part is described below.
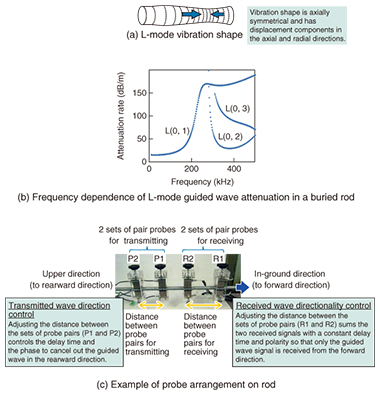
2.1 Ultrasonic guided wave technology for underground rodsUltrasonic guided waves*1 differ from ordinary ultrasonic waves (bulk waves) in that their propagation is confined to within an object. There is less attenuation of guided waves over distance than for ordinary bulk waves, so they propagate over longer distances. For that reason, guided waves are being used in the development of diagnostic technologies for pipelines and other such structures [1]. However, there are some problems to be solved before guided waves can be applied to diagnose rods. (1) In an underground environment, the energy loss of the guided wave outside the rod results in high attenuation. (2) For rods that are in current use, particular probes are required that enable guided waves to be transmitted and received from the above-ground portion of the rod. (3) Detection of the signal reflected from underground thinning or defects with good sensitivity (high signal-to-noise ratio: SNR) is difficult because noise that originates outside the underground part of the rod is generated. As the first step in solving these problems, we investigated ultrasonic wave modes and frequencies. A guided wave propagating in a cylindrical, isotropic, homogeneous elastic body such as a metal rod may have one of three modes, depending on the vibration pattern. One of those modes is the L mode, which has the vibration shape illustrated in Fig. 2(a). We calculated the dependence of the attenuation rate on frequency assuming that the propagation of the guided wave in the L mode had the vibration pattern shown in the figure in a rod buried underground. The results for a rod with a diameter of 13 mm obtained using ordinary soil characteristics are shown in Fig. 2(b) [2]. On the basis of these results, we selected a 60-kHz, L(0, 1)-mode guided wave as having a low attenuation rate. Next, we designed and fabricated compact probes that have built-in piezoelectric vibration elements that generate vibrations at 60 kHz for transmitting and receiving the guided waves from the side of a thin rod. In the measurements, we used pairs of probes that had the same performance, and we set the two probes in each pair on opposite sides of the rod. The probes are driven with the same phase, and the received signals are summed so that the L mode signal can be transmitted and received selectively. We further arranged multiple pairs of probes to enable control of the direction and directionality of the transmitted and received wave signals (Fig. 2(c)) to achieve a higher SNR and improve sensitivity [3].
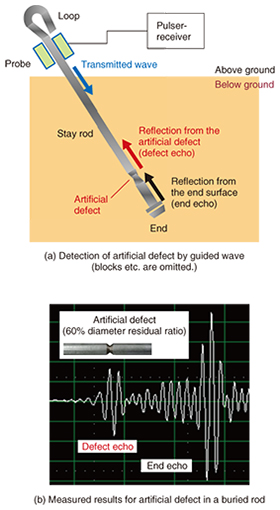
We used the equipment configuration described above together with a new sample rod in which an artificial defect was formed to investigate the feasibility of detecting the defect under the same conditions as for an actual buried rod. The concept of defect detection by a guided wave is illustrated in Fig. 3(a), and an example of the actual measured results for a buried rod (13 mm in diameter and 215 cm in length, with a 10-mm-wide artificial defect that reduced the diameter by 40%) is presented in Fig. 3(b). A clear echo from the artificial defect is observed in the result, confirming that it is possible to detect an underground artificial defect with this method. We are currently conducting field testing of this diagnostic technology to verify the feasibility of detecting actual degradation from corrosion thinning with the cooperation of NTT EAST and NTT WEST.
2.2 Investigation of method to estimate degradation in buried anchorsIn addition to the ultrasonic guided wave diagnosis technology for stay rods, we are investigating a method for estimating the degree of degradation in underground anchors due to corrosion, since anchor types are used in far more facilities than block types, but the ultrasonic wave is not transmitted to the anchors. For anchors, the supporting force is obtained from the part that is driven into the ground. We are therefore investigating corrosion degradation in the underground part of the anchor over time and constructing a degradation model, which we will use to calculate strength in order to implement technology to determine when renovation may be necessary.
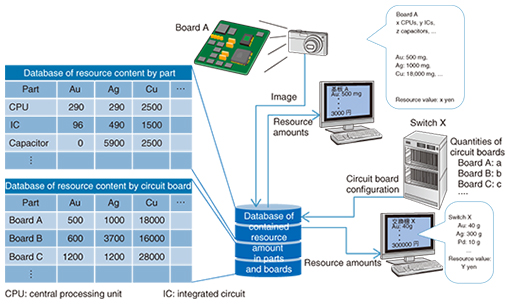
3. Resource visualization technologyResource visualization technology is used to understand the types and amounts of resources contained in telecom facilities and to identify locations of uneven distribution of resources in order to provide information for advanced recycling of discarded equipment. Information on toxic materials such as lead and heavy metals has been available for some time because manufacturers are obligated by law to report the content of harmful substances in order to prevent any harmful effects on human health in the use and recycling stages. However, the contents of gold, silver, and copper, which can be recovered through recycling, are not reported because there is no obligation to do so on the supply side. Therefore, the discarding of equipment has generally been handled without information on the amount of resources contained in the equipment. 3.1 Purpose of resource visualization technologyUsed switching equipment accounts for the second-largest amount of waste generated by the NTT Group, after concrete utility poles. Many kinds of materials are used in switching equipment to achieve high performance, so the discarded equipment itself can be an important resource. We therefore consider the new node switches, which will be discarded in large numbers in the future migration of the public telephone network, to be a promising subject for research on technology for visualizing material resources. Analyzing and estimating the contents of resources are core technologies for resource visualization technology. Knowing the types and amounts of material resources of discarded equipment in advance will lead to better selection of an optimal recycling method. Moreover, knowing which parts contain the greatest amounts of rare metals would make it possible to concentrate those resources by collecting the appropriate parts and to increase the recovery efficiency. Improving recycling processes can be expected to reduce the cost of disposing them, thus accomplishing two goals at the same time. 3.2 Development of resource visualization technologyMaterial resource visualization involves the use of analysis and estimation technologies. The resource contents of typical components and circuit boards are analyzed, and the results are stored in a database, as shown in Fig. 4. With circuit boards for which the resource content is unknown, the types and numbers of components mounted on the board are input, and the content is estimated by obtaining data on parts information and/or content for similar parts from the database.
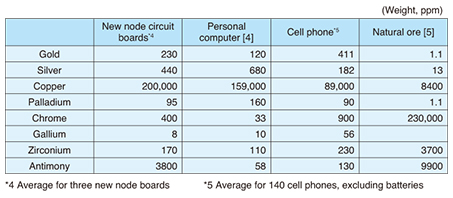
New node switches use many kinds of circuit boards, so we first investigated the various circuit boards used in the switches. We selected typical boards that are common to all switches and that are present in large numbers. Next, we selected material resources that have high economic value and a high risk of depletion. As a result, we selected eight elements for quantitative evaluation, including gold, silver, copper, and palladium. The challenge in developing the analytical method was to find a way to analyze easily and circumstantially the target elements in circuit boards that contain plastics as well as various kinds of metals. We first tried the usual inductively coupled plasma (ICP) analysis*2, but the preparation of samples in solution form requires a complex and expensive process. Therefore, X-ray fluorescence analysis*3 was used together with ICP analysis because the preparation process is simple; the samples are prepared by pulverizing and compacting the boards. We are therefore investigating an analysis method using ICP and X-ray fluorescence accordingly as a method for simple quantitative analysis within the permissible range of accuracy. As an estimation method, we are investigating a summing method in which the amounts of resources contained in the components stored in the database are multiplied by the number of each type of component. An advantage of this method is that the amounts of resources contained in circuit boards for which resource content information is not available can be estimated without pulverizing the boards. We are also investigating the application of image processing technology for fast and easy automatic recognition of components from images rather than relying on visual counting by human workers alone. Such technology would be particularly effective for small and numerous components such as chip condensers, and for components that have many varieties and are difficult to classify such as IC chips. We have used this approach to clarify that new node circuit boards and cell phones contain many metals that have high economic value and a high risk of depletion as natural resources (Table 1).
3.3 Future work in resource visualizationMany valuable material resources are contained in telecom facilities. To provide safe and secure ICT services in the future, it is necessary to have a stable supply of resources and to optimize recycling costs. We believe that advanced recycling based on information on resource contents provided by resource visualization technology will contribute to achieving sustainable ICT services. Our objectives in the future include expanding the targeted equipment, expanding the database, and improving the estimation accuracy. We would also like to investigate methods of providing information that take into consideration future risks to the environment, economy, and society.
References
|
|||||||||||||||||