|
|||||||||||||
|
|
|||||||||||||
|
Feature Articles: Interdisciplinary R&D of Big Data Technology at Machine Learning and Data Science Center Vol. 14, No. 2, pp. 9–13, Feb. 2016. https://doi.org/10.53829/ntr201602fa1 R&D Activities at Machine Learning and Data Science CenterAbstractThe Machine Learning and Data Science Center (MLC) was established in April 2013 as a research and development hub of big data analysis technologies at NTT laboratories with the aim of creating innovative services from a wide variety of big data. MLC uses machine learning and data mining technologies cultivated by NTT laboratories and a parallel-distributed processing platform (Jubatus) for high-efficiency and real-time data analysis to develop diverse big data analysis technologies and support big data services. This article introduces these big data activities at MLC. Keywords: big data, machine learning, data science  1. IntroductionMachine learning and data mining are considered to be promising technologies for analyzing diverse types of big data. However, a single core technology is insufficient for achieving innovative services that make use of big data, so a composite technology that combines key technologies is essential. A parallel-distributed computation platform is also needed to efficiently process huge volumes of data. Furthermore, to conduct technology trials in the field and to uncover business needs, close discussions with specialists in applied fields are needed. Against this background, the Machine Learning and Data Science Center (MLC) was established in April 2013 at NTT laboratories as an inter-laboratory collaborative organization focused on big data analysis [1]. At MLC, however, we do not limit ourselves to collaboration within NTT laboratories. We also pursue open innovation in collaboration with NTT business companies, NTT Group companies, and even other firms and research institutions. Our aim here is to perform research and development (R&D) and provide technology support for various types of big data analysis both inside and outside the NTT Group. At present, our R&D activities at MLC are focused on the following technologies:
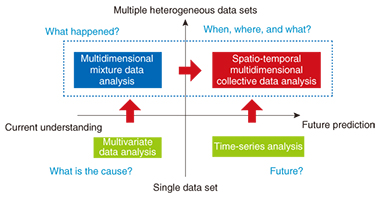
We are supporting such big data analysis efforts at NTT laboratories through the brand name himico. Other Feature Articles in this issue provide detailed descriptions of the above, but this article provides an overview of these R&D areas and explains their importance. 2. Internet of ThingsIt has been more than five years since the concept of big data was first proposed. At first, however, it was more of a concept than a reality, and there were questions as to how big data differed from business intelligence, and how big data analysis differed from existing analysis technologies. In short, definitions of big data and big data analysis were unclear from the start. In time, though, advances in sensor technologies would enable the use of sensors in all sorts of fields including social infrastructures, medicine and healthcare, transportation, and agriculture, and at present, an environment is evolving in which massive amounts of data can be collected and analyzed in real time. This is none other than the birth of a concept called the Internet of Things (IoT), and it is through IoT that the true nature of big data is finally revealing itself. The R&D vision for big data analysis technologies in the IoT era as envisioned by MLC is shown in Fig. 1. In this vision, regression analysis (also called multivariate data analysis), which is representative of conventional data analysis, aims to describe an objective variable using multiple explanatory variables. That is to say, it is an analysis technique for determining whether an objective variable (for example, sales) can be expressed as a function of explanatory variables (factors). A famous case study of regression analysis is the estimation of wine prices by Professor Orley Ashenfelter. Using three explanatory variables (winter rainfall, average temperature during growing season, rainfall during harvesting season), he claimed on the basis of data only that the price of wine (objective variable: y) could be expressed by the following formula:
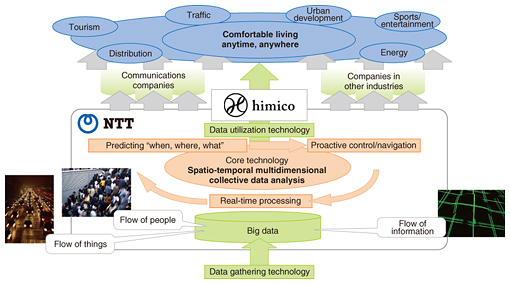
y = 12.145 + 0.00117 × (winter rainfall) + 0.0614 × (average temperature during growing season) – 0.00386 × (rainfall during harvesting season) Also important in big data analysis is clustering technology that extracts clusters (groups) of data with similar features from big data to uncover latent value hidden in data. In the IoT era, however, there is a need for technology that can extract latent information spanning heterogeneous (multidimensional mixture) data sets, which cannot be discovered by individually analyzing different sets of data. To this end, NTT laboratories have developed a technique called multidimensional mixture data analysis that enables multiple heterogeneous sets of data to be simultaneously analyzed. The usefulness of this technique has been demonstrated through actual field trials. 3. Spatio-temporal multidimensional collective data analysisThe IoT era will also feature the collection of real-world information linked to time and space (location) from all sorts of sensors. This type of data is called spatio-temporal data. With reference to Fig. 1, time-series analysis attempts to model the temporal interaction or cause-and-effect relationship between data, but spatio-temporal analysis attempts to construct models that also consider the spatial dynamics among data. To analyze the spatio-temporal behavior of people and things and predict when, where, and what in real time, NTT laboratories established a research theme called spatio-temporal multidimensional collective data analysis. This form of analysis considers time and space along multidimensional axes and uses past data from a certain period of time to learn about the mutual relationships between time and space with respect to the flow of people, things, information, and other factors. Additionally, as an application example, R&D is underway on anticipatory people-flow induction based on spatio-temporal prediction. The importance of anticipatory induction and the usefulness of the proposed technique were demonstrated through computer simulation of a major event on a scale of 5000 people. Information on the above topics can be found in the feature article “From Multidimensional Mixture Data Analysis to Spatio-temporal Multidimensional Collective Data Analysis” [2] included in this issue. 4. Parallel-distributed processing platform (Jubatus)In the IoT era, we can expect massive amounts of diverse types of data to be generated from moment to moment. Under these conditions, there is a need for a high-efficiency processing platform that can analyze such streams of data in real time. The feature article “The Latest Developments in Jubatus, an Online Machine-learning Distributed Processing Framework” [3] included in this issue provides an overview of Jubatus, presents examples of recent developments, and discusses future developments. Jubatus is open source software developed jointly by Preferred Infrastructure, Inc. and NTT laboratories prior to the establishment of MLC in 2011. In contrast to the Hadoop parallel distributed processing platform that performs batch processing on stored data, Jubatus performs parallel distributed processing oriented to online data processing, which means it is a processing platform specially suited to the IoT era. The usefulness of Jubatus has already been demonstrated in the high-speed analysis of data generated by social networking services (SNS), but more recently, it has come to be applied in a variety of areas including real-time recognition of images from surveillance cameras (dress, behavior, etc.). 5. Ultrahigh-speed graph mining engineIn comparison to conventional tabular data, graph structured data that represent the relations among diverse items of information such as people, things, and places are referred to as unstructured data. As the name implies, graph structured data are represented by a graph in which the edges of the graph constitute connections between nodes or items of data. Graph structured data can represent a variety of phenomena such as links between web pages, friend relationships in SNS, and road networks. The process of extracting useful latent information hidden in graph structures such as the extraction of a strongly connected group of nodes is called graph mining, which has recently been a focus of research in the field of data mining. NTT laboratories have been researching and developing a graph-mining engine named Grapon for ultrahigh-speed analysis of large-scale graphs. One important application of Grapon is balanced granularity partitioning. In a verification experiment performed by NTT DATA in China on traffic-signal control for eliminating road congestion based on a multi-agent simulation, the use of balanced granularity partitioning proved to be effective for accelerating simulation processing. Specifically, NTT DATA achieved high-speed parallel simulation here by treating the road network as graph data and partitioning the resulting large-scale graph into smaller well-balanced graphs to level the parallel processing load of congestion prediction. Information on this topic can be found in the feature article “Advanced Processing and Analytics for Large-scale Graphs” [4] included in this issue. 6. Network fault detection, premonitory signs and prediction, optimizationThe increasing scale and complexity of networks in recent years has been accompanied by an increasing number of cases in which network faults and their causes are difficult to detect and deduce. At NTT laboratories, R&D has begun on a new type of big data analysis in the network field that uses machine learning and data mining technologies to estimate network conditions. This form of analysis inputs network operation data and traffic data such as system log (syslog) data that has not been used effectively in the past. The aim here is to develop technologies that use operation/traffic data to predict and detect network operation problems (faults, congestion, etc.), determine and visualize network conditions, and isolate problem factors. It is common in conventional fault detection using syslog data to apply methods based on previously established rules (empirical knowledge). However, the conversion to software and the virtualization of network functions in software-defined networking means that network devices and their configuration and the syslogs and patterns generated will change dynamically, so formulating rules beforehand is difficult. In response to this problem, NTT laboratories have developed a fault detection method based on patterns generated in syslogs. This method is described in the feature article “Improving Network Management and Operation with Machine Learning and Data Analytics” [5] included in this issue. 7. Trial based on merging of big data technologiesIn addition to the development of elemental technologies for big data analysis, MLC also conducts technology trials in collaboration with partners both inside and outside NTT. One example is the Fukuoka tourism trial targeting foreign visitors to Fukuoka City in Japan. For this trial, we merged big data analysis technologies developed by NTT laboratories to establish advanced, high-performance big data usage technology and tested its usefulness through the course of this trial. Specifically, we distributed a smartphone app to foreign visitors in Fukuoka and analyzed their movements based on the location and attribute information obtained from the app. This analysis helped us to discover interesting movement patterns and improve the opening rate of messages pushed to the app based on the analysis of tourist behavior. Information on this trial is provided in the feature article “Advanced, High-performance Big Data Technology and Trial Validation” [6] included in this issue. 8. Future developmentsAt MLC, we plan to collaborate with NTT laboratories and external parties to find problem solutions that are difficult to develop by a single organization. Our aim is to achieve a comfortable level of traffic in a broad sense that includes network traffic, people flow, and vehicle flow. We intend to accomplish this by using spatio-temporal multidimensional data analysis to develop technology for making real-time, highly accurate predictions of where and when an event will occur and to establish proactive control and induction technology (Fig. 2). Additionally, we aim to establish globally unprecedented and business-creating technologies for isolating the causes of silent failures and congestion and to achieve proactive network operation.
Today, at the dawn of the IoT and big data era, MLC in unison with the NTT Group plans to form collaborative relationships in rolling out next-generation big data business as the value partner that customers continue to select. References
|
|||||||||||||