|
|||||||
|
|
|||||||
|
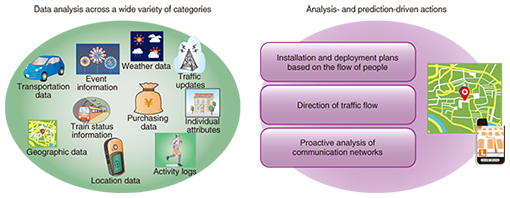
Feature Articles: Interdisciplinary R&D of Big Data Technology at Machine Learning and Data Science Center Vol. 14, No. 2, pp. 40–46, Feb. 2016. https://doi.org/10.53829/ntr201602fa6 Advanced, High-performance Big Data Technology and Trial ValidationAbstractTourism to Japan is expected to increase as the year 2020 approaches. In every possible scenario, people will need access to stable transportation and communication services as well as other social infrastructure. NTT is researching and developing solutions to meet these requirements by using big data technologies. In this article, we present one such advanced, high-performance big data technology, and we describe the results of a field test (the Fukuoka trial) of services for tourists visiting Japan. Keywords: big data, clustering, prediction  1. IntroductionWith Tokyo chosen as the host for the 2020 Summer Olympic and Paralympic Games, it will become important to stabilize communication networks while understanding and relieving congestion in the areas around such massive events. Similarly, a stable societal infrastructure is also needed in order to deal with any large-scale disasters that might occur. We can expect to be able to address these issues (i.e., understand and relieve congested conditions) through the application of big data technologies using location data from now-ubiquitous smartphones and car navigation systems. However, NTT’s big data methodology does not simply involve analyzing location data independently. Our research and development (R&D) efforts are instead aimed at discovering insights that could not be gleaned from a single category of data alone. To do this, we analyze several disparate categories of data together; the data include a variety of user attributes and behaviors as well as local geographical and weather data. We believe that this type of analysis will allow us to provide appropriate information based on various factors such as location data, user attributes, time of day, and weather during events in the near future. Furthermore, we expect to be able to apply this information to guidance services and to services that control said guidance by predicting changes in both human and network flows from a variety of factors in the event of a disaster. In this article, we present an advanced, high-performance big data technology we have developed in order to analyze data across a wide variety of categories, particularly location data. We first explain the technology’s overarching structure along with each analysis technique. Then we present our analysis of a sample trial we conducted with overseas tourists visiting Fukuoka City. 2. Advanced, high-performance big data technologyWe developed our advanced, high-performance big data technology primarily to analyze the flow of people, a process that involves examining location data and other types of activity logs (Fig. 1).
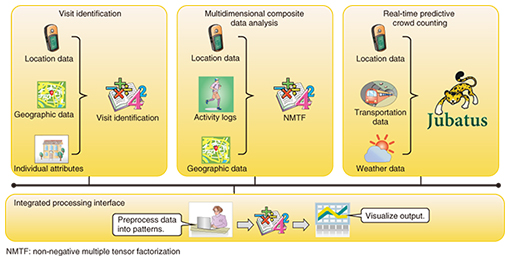
In recent years, technologies such as GPS (Global Positioning System) have made it easy to obtain the geographic coordinates of smartphones and other portable computing devices. However, it has been difficult to analyze user activity such as that related to sightseeing and lodging via ordinary statistical techniques (e.g., sums and averages) on this kind of movement tracking data, which represent a massive time series. Our visit identification techniques can solve this problem by predicting where people have visited or stayed from movement tracking data that contain many measurement errors, noise, and missing values. At the core of our advanced, high-performance big data technology is our multidimensional composite data (cluster) analysis, which can collectively analyze data across a variety of categories, including user attributes (e.g., age and residence), weather data, and predicted visits. Furthermore, we have prepared real-time predictive crowd counting techniques that can analyze users’ location data in real time to predict the size and movements of crowds of people several hours in the future. Our advanced, high-performance big data technology is thus characterized by their ability to use three core components together on a single platform (Fig. 2). By providing a single platform for integrated data analysis with a simple user interface, shared data preprocessing, visualization of prediction results, and other features, we can reduce the amount of work that must be done by data analysts.
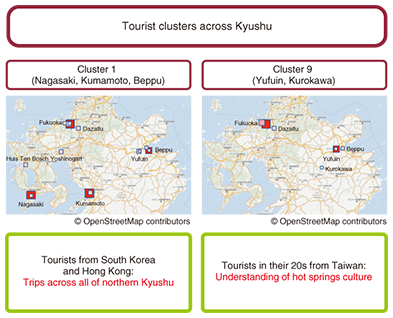
2.1 Visit identificationWhen analyzing user movement tracking data, we first need to convert it into information that tells us how long users spent at any given location, taking into account the effects of noise caused by measurement errors in any location data obtained from smartphones. NTT Service Evolution Laboratories has researched and developed a visit identification technique that estimates both the locations people have visited as well as their actual destinations (e.g., parks and cafés) from movement tracking data with overlaid noise. We are attempting to improve the accuracy of our identifications by taking individual preferences and time spent at any given location into account rather than relying on physical proximity alone. Furthermore, our technique takes advantage of parallelization to allow it to quickly process the movement tracking data for many different people in a short amount of time. 2.2 Multidimensional composite data analysisThis clustering technique is at the heart of analyzing data together across many diverse categories; it is based on non-negative multiple tensor factorization (NMTF), which is explained in detail in this issue’s feature article, “From Multidimensional Mixture Data Analysis to Spatio-temporal Multidimensional Collective Data Analysis” [1]. Although an analysis of many different categories of data at the same time will take place in an extremely large (sparse) data space, NMTF reduces computational costs and allows data to be analyzed more efficiently. Clustering results are characterized by a combination of several factors when they are visualized or semantically interpreted. For example, one such result might be that during weekends, most café patrons in the western districts are women in their 30s from the eastern districts. This allows us to discover properties that we could not have found through simple combinations. The actual data analysis work requires us to repeatedly change parameters (e.g., input data weights and cluster counts) and re-analyze the data while interpreting the results. A graphical user interface (GUI) allows anyone to run our multidimensional composite data analysis even without a detailed understanding of the underlying algorithms. 2.3 Real-time predictive crowd countingThis technique analyzes location data in real time to estimate how many people are or will be in a given area. Activity logs and other location data are constantly being updated. To keep up with this flow of data, we need to add the latest updates to our accumulated time series and analyze them in real time. Our implementation of this real-time analysis uses Jubatus [2], a distributed processing framework for online machine learning that is also presented in one of this issue’s feature articles [3]. To visualize the analyzed data, we use a GUI with a heat map overlaid on a geographic map. The actual process of analyzing the data involves tuning our machine learning models on the basis of a side-by-side comparison of the actual and expected results. We expect this to allow us to make more accurate predictions of the number of people in any given area. For example, we believe that we can apply this technique to the constantly shifting flows of people during an event to predict how many people with particular attributes will be in each area and thus anticipate where to post personnel. 3. Trial application with Fukuoka tourismTo validate the effectiveness of our techniques, we participated in a field trial intended for tourists visiting Japan from overseas. We present here the results of analyzing actual data from the trial. During the trial, we distributed a smartphone application (or tourist app) to tourists visiting Fukuoka City and its surrounding tourist destinations. In addition to connecting to free Wi-Fi hotspots, the app provided useful services such as tourist information and coupons relevant to its user’s activities and circumstances. With the tourists’ advance consent, we collected the app’s usage logs, location data, and individual characteristics such as gender, year of birth, and country of residence. By analyzing such data with our advanced, high-performance big data technology, we were able to find patterns in tourist trips and activities, estimate how many tourists would visit individual areas, and explore other avenues of inquiry. 3.1 Analyzing patterns in trips and activitiesWe collected movement tracking data in the form of latitude and longitude coordinates at fixed time intervals. However, this is not appropriate for determining where a trip begins (e.g., at a store) and ends (e.g., at a tourist destination) because the data sets are large and include location data while people are in transit. Using our visit identification technique, we converted movement tracking data into visits (location data indicating where we determined that tourist app users stayed for some period of time). By further dividing locations into 500-m2 areas and counting the number of times each user stayed in each area, we were able to analyze users’ movement from one area to the next. These techniques produced a multidimensional data set with information on each user, including areas visited, movement patterns between areas, times of day, gender, age (by decade), and country of residence. We then used our multidimensional data analysis techniques to cluster the data. We analyzed trips and activities for both the island of Kyushu and the city of Fukuoka to discover patterns that were characteristic of each (Figs. 3 and 4). We believe that taking these activity patterns into account could allow tourist campaigns to both attract and satisfy more tourists.
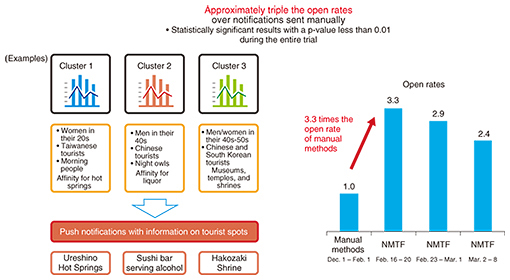
(1) Patterns in trips and activities over large areas • Most of the tourists were from South Korea and Hong Kong; their travels took them to Nagasaki, Kumamoto, Beppu, and other major tourist destinations all across the northern region of Kyushu. • There were many younger tourists from Taiwan who traveled to hot spring resorts, including the Yufuin hot springs in Oita Prefecture and the Kurokawa hot springs in Kumamoto Prefecture. (2) Patterns in trips and activities over small areas • A noticeable number of tourists in (or near) their 30s from South Korea and Hong Kong visited locations throughout downtown Fukuoka. • Taiwanese tourists in their 30s traveled large distances east and west across the urban districts of Fukuoka City during the day but returned to the downtown area at night. 3.2 Improving push notification open rates by analyzing trips and activitiesIn conducting our multidimensional composite data analysis, we augmented users’ location data and attributes with category data on points of interest (such as tourist destinations and stores) in each area; this allowed us to cluster the data according to each area’s characteristics such as how many tourist attractions and restaurants it contains. Because we can estimate how tourists’ individual attributes are related to the areas and categories of places they are likely to visit, we can also make effective recommendations based on those attributes. On the basis of our actual clustering results from this trial, we sent push notifications to our tourist app with information on tourist spots and categories tailored to individual combinations of country of residence, age (by decade), and gender. We found that these notifications were more than three times as likely to be opened as notifications sent out according to manual rules (Fig. 5).
3.3 Verifying the accuracy of real-time predictive crowd countingWe analyzed location data to predict how many people would be downtown several hours in the future. To fill in the gaps presented by missing location data and improve the accuracy of our results, we interpolated the location data before making any predictions. After analyzing input data between December 1, 2014 and March 22, 2015, we found that our predictions still remained accurate when the number of tourists doubled during the Chinese New Year (from late February until early March). 4. Future plansRather than limiting ourselves to studying the flow of people, we will continue to pursue R&D efforts targeted at making social infrastructure—such as transportation and communication services—more stable. In addition to analyzing data, we will gather proof of the effectiveness of big data technologies for forecasting, control, and other applications. References
|
|||||||