|
|||||||||||||
|
|
|||||||||||||
|
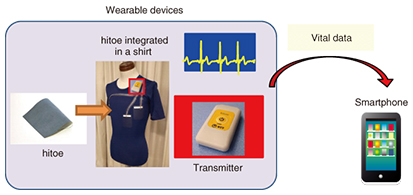
Regular Articles Vol. 14, No. 4, pp. 47–53, Apr. 2016. https://doi.org/10.53829/ntr201604ra1 Gait Analysis Using a Wearable T-shirt Type SensorAbstractNTT has developed a T-shirt type sensor that enables continuous measurement of the heart rate of the person wearing it. The sensor links to a smartphone, with which the user can easily see the measured heart rate variation. Vital signs such as heart rate variations will be more valuable when combined with information on the situation or activity context of the user. We developed a new method to analyze the user’s gait information by using a three-axis acceleration sensor built into the T-shirt type sensor. We describe in this article the gait analysis procedure and an example of the result of continuous measurement for one day. This method is easily implemented as an application in a smartphone and enables simultaneous measurement of heart rate variation and gait information. Keywords: wearable, heart rate variation, gait analysis  1. IntroductionWearable technology is becoming increasingly common, and many devices are now commercially available. This is making the measurement of vital data much easier [1]. Such technologies are expected to lead to the creation of new services in fields such as sports training, health and fitness, security and safety monitoring, medical care support, and entertainment. NTT has developed a wearable technology called hitoe, which is a conductive fabric, and a T-shirt type heart rate sensor incorporating hitoe (Fig. 1) [2]. Variations in the heart rate are detected as signals when the user wears the hitoe T-shirt. The signals are amplified, digitized, and wirelessly transmitted to an external device such as a smartphone via a transmitter coupled to the T-shirt. This T-shirt type fabric with built-in sensor is stretchy and comfortable, so the user can move around freely during the measurement; these features enable continuous measurement of the user’s heart rate, making it possible to pick up heart rate variation.
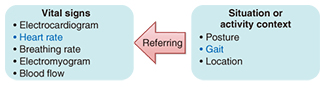
Vital signs recorded in this way will be more valuable when they are provided with information on the activity context of the user (Fig. 2) [3]. It can be inferred that a change in the heart rate variation that occurs while a user is standing quietly would be different from the change that occurs while the user is running. Sending the information on the activity context of a user is helpful in inferring the reason for the change in vital signs. Our objective was to fabricate a method of simultaneously inferring the activity context of a user during the measurement of heart rate variation using hitoe.
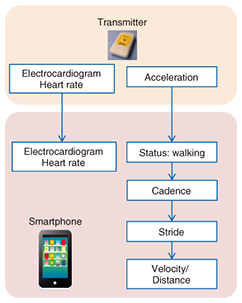
To infer the user context, we focused on information concerning walking because walking is a basic means of moving around both indoors and outdoors. Walking information gives meaningful hints to infer the user’s activity context. For example, if there is no step detection for a few hours during the daytime when the user is in an office, it can be inferred that the user stayed in the same place. If the status of running is detected for a few hours, it most likely indicates a period of exercise. We devised the new gait-analysis method by using the three-axis acceleration sensor installed in a transmitter attached to a T-shirt (Fig. 3). Unlike a GPS (Global Positioning System) sensor, an acceleration sensor works effectively even inside buildings. Therefore, it is suitable for gait analysis applications in daily life.
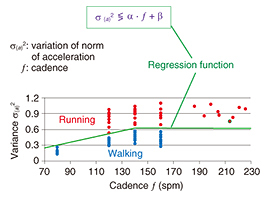
This article proposes a new method to analyze exercise mode, cadence, speed, and distance by using the measured vibrations of acceleration. In the exercise mode, the method distinguishes whether a user is walking, running, or resting. Cadence means the total number of steps per minute (spm). Speed is the walking or running velocity per hour, and distance is the total length of movement. This method is based on simple mathematics and is easily implemented as a smartphone application, which makes it possible to simultaneously measure heart rate variation and gait information. 2. Method to infer the movement status of a userWe first developed a method to infer the exercise mode of a user from data provided by the three-axis acceleration sensor. We investigated the relation between exercise mode and acceleration by measuring the vibration of acceleration when 11 users were walking or running at a variety of cadences. In this experiment, each user wore a watch with an alarm that beeped at a rate of 120, 140, and 160 times per minute, and they were instructed to walk at a cadence that matched the timing of the alarm. The result is shown in Fig. 4. The horizontal axis is the cadence, and the vertical axis is the variance of the norm of acceleration. The graph shows that the groups of plot points for walking and running have a tendency to be separated, so we set a regression function that lies in the middle of those groups in order to distinguish them. If a measured variance is over the function, the mode is inferred as running; otherwise it is walking. If the cadence is less than 60 spm, no matter what the variance is, the status is inferred as resting because a healthy person does not walk at a cadence below 60 spm without reason [4]. As a smartphone application, the gait analysis method infers the exercise mode in real time by using the regression function, which is the function of cadence. The method used to calculate cadence is described in the next section.
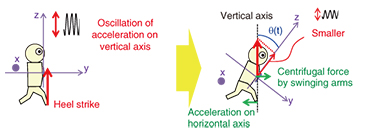
3. Method for calculating cadence and step detectionAs previously mentioned, cadence is defined as the total number of steps per minute. Thus, precise step detection makes it possible to calculate cadence. The main factor in detecting the number of steps and calculating cadence is the leaning angle of the upper body. When people walk or run, they generally lean forward slightly. The leaning angle affects the measurement of acceleration because the transmitter is located on the user’s upper body. It is quite common to count steps by measuring the acceleration along the axis perpendicular to the horizon because it shows a distinguishing peak at the moment of a heel strike, which is when the heel touches the ground (Fig. 5) [5]. However, if the upper body leans forward, the axis is no longer vertical, and the amplitude of oscillation of acceleration becomes smaller. Additionally, the influence of the acceleration on horizontal axis and the motion of rotation of the upper body by swinging the arms becomes larger, making it difficult to detect the peak. Thus, a method that is not affected by the lean of the upper body is required.
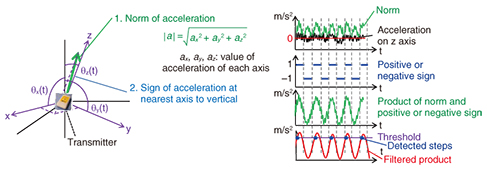
We used the norm of acceleration to avoid the influence of leaning because leaning of the axis can be handled as a transformation of the Cartesian coordinate, and the norm is not changed by this. However, acceleration along the vertical axis takes both a positive and negative value, but the norm takes only a positive value. Because of this difference, the norm often increases even if acceleration along the vertical axis decreases, and this makes it difficult to count the number of running steps. To solve this problem, we devised a method to estimate the lean of the transmitter integrated into a T-shirt by selecting the nearest axis to vertical (Fig. 6). If the value of acceleration measured on the nearest axis is negative, the norm is multiplied by minus one and treated as a negative value, and if it is positive, the norm is handled as a positive value. The product of the norm and a positive or negative sign cyclically changes and matches the step cycle. This product is applicable as a filter to reduce noise or a discriminator to count steps with a threshold.
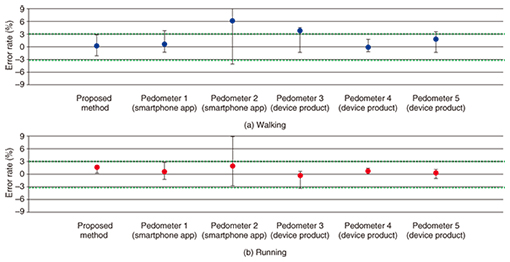
We also evaluated the step detection method. Eight people walked and ran on a straight horizontal road 500 m long. They each wore a T-shirt type sensor as well as a pedometer for reference. To count the actual steps, each participant held a handy counter that they clicked every time they took a step. The results are shown in Fig. 7. The error rate E is defined as the following equation.
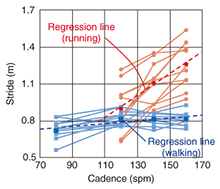
where Se is the estimated steps measured using this method, and Sa is the number of actual steps. The plot points show the median of the error rates of eight people, and the bars show the maximum errors. The length of the error bar with our method is within plus or minus 3% for both walking and running. These results reflect the stability and accuracy of our step detection method. This method also enables us to use the regression line, which is described in section 2, and to infer the exercise mode. 4. Method to estimate velocity and distanceWe used the following equations to calculate walking speed and distance, where v is velocity [m/min], l is stride [m], f is cadence [steps/min], d is distance [m], and Δt is measurement time interval [min]. Estimating the stride enables us to calculate the velocity and then the distance. We investigated the strides of 11 people and calculated the regression lines as a function of cadence by using the value of average cadences (Fig. 8).
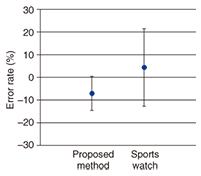
The regression lines give the approximate values of stride for each cadence value. By using these regression lines of stride, we devised a method to estimate stride and to estimate velocity and distance with v and d in eqs. (2) and (3). The regression lines of stride while walking and running have different slopes. Therefore, first the exercise mode is inferred, and the proper line is chosen depending on the mode. Then, the distance and velocity are estimated in real time. The result of distance calculation is shown in Fig. 9. In this experiment, four people walked and ran 300 m six times. They were not directed to use any particular cadence. The plot points show the average error rate, and the bars show the standard deviation. The bar using the proposed method is shorter than that of a sports watch used as a reference, which indicates the proposed method was more accurate in calculating distance.
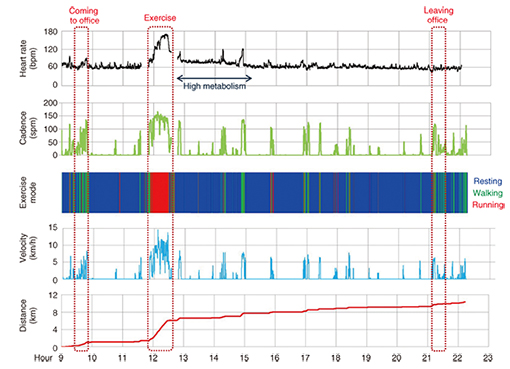
5. Example of heart rate referenced with gait analysisAn example of the results of gait analysis for one day is shown in Fig. 10. The results show that for this user, the exercise mode was primarily resting, indicated in blue. This participant in fact spent most of the time during the measurement sitting down and working at a computer. During the time the participant was going to work and was leaving the office later, the exercise mode indicates walking, and when the person exercised during lunch time, it indicates running. Consequently, these results indicate that our method is a feasible technique for inferring a user’s activity in daily life. Interestingly, after reaching a resting state after exercising, the heart rate was higher than that of the pre-exercise resting state. This is because there is a tendency for the metabolism to remain at a higher level for several hours after exercise [6]. Multi-monitoring of heart rate and gait makes it possible to gain a better understanding of the changes in vital signs.
6. Future developmentIn this article, we described an example of multi-monitoring with a T-shirt type heart rate sensor and an acceleration sensor. This approach to fusing sensors is expected to lead to new applications or services in a variety of fields. We plan to continue our development with the aim of putting the sensor fusing approach to practical use in order to contribute to meeting social needs. AcknowledgmentsThe authors would like to thank Takako Ishihara of NTT Device Innovation Center and Kenta Maruyama of Abeism Corporation for their support at experiments. References
|
|||||||||||||