|
|
|
|
|
|
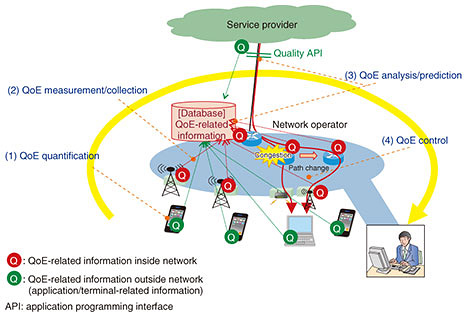
Regular Articles Vol. 16, No. 10, pp. 71–76, Oct. 2018. https://doi.org/10.53829/ntr201810ra2 QoE Visualization and Prediction Model for QoE ImprovementAbstractThe use of smartphones continues to spread, and smartphone services are becoming increasingly diverse. In response to these trends, NTT Network Technology Laboratories is researching quality of experience (QoE)-centric operation, which takes into consideration the effect of network quality on the QoE of services. In this article, we summarize a QoE visualization and prediction model, which is one of the components of QoE-centric operation. We also explain how the concept of co-created quality enables all actors in a network to contribute to QoE improvement by providing service providers or users with visualized information that is the output of this model. Keywords: QoE visualization, QoE prediction, network operation  1. IntroductionThe advancing functionality of smartphones and the continued progress in cloud services have led to the provision of numerous types of communication services through telecommunications networks. However, the necessary network quality for each service is different, and the effect of network quality degradation on each service is also different. Therefore, it is difficult to determine whether users can use each service comfortably only by monitoring network quality. Thus, the impact of network quality degradation must be understood from the viewpoint of quality of experience (QoE), and this will enable service quality to be optimized from the user’s perspective. To improve QoE, we aim to develop QoE-centric operation: an operation cycle that includes QoE quantification and optimization based on QoE-related information (network, terminal, or user information that affects QoE) obtained from in-service monitoring. To realize this cycle, NTT Network Technology Laboratories is researching four component technologies: (1) QoE quantification, (2) QoE measurement and collection, (3) QoE analysis and prediction, and (4) QoE control (Fig. 1).
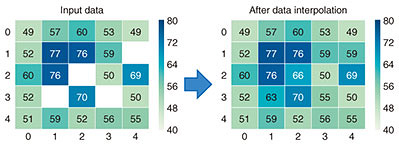
QoE quantification derives relationships between QoE and QoE-related information. QoE measurement and collection measures QoE-related information and stores it in a database. QoE analysis and prediction visualizes the impact range of QoE degradation by QoE quantification or analysis of QoE-related information in the database and supports network operation by predictive detection or cause analysis for QoE degradation. QoE control optimizes QoE through optimal network resource allocation, policy control, or video delivery control. In this article, we introduce a QoE visualization and prediction model, which is one of the technologies in QoE analysis and prediction. 2. Technologies composing QoE visualization and prediction modelThe QoE visualization and prediction model visualizes the QoE status and time-series changes on a map by analyzing QoE-related information collected from user terminals or network devices, for example, terminal information, signal reception quality, and network quality. Furthermore, this model predicts future QoE based on predicted QoE-related information that changes in a time-series. We are studying three network artificial intelligence (AI) techniques: (A) data interpolation, (B) QoE estimation, and (C) time-series prediction (Fig. 2). First, QoE-related information collected and measured using a crowdsourcing approach is used as the input of this model. However, it is difficult to collect QoE-related information for all periods of time and all areas. Thus, we apply data interpolation to interpolate the value of QoE-related information based on the relationships among these values in the surrounding area.
Next, QoE estimation is used to derive relationships between QoE and QoE-related information by analyzing these values and to compute the QoE from input values that are collected or interpolated from QoE-related information for each period of time or each area. Thus, QoE is visualized on the map for each time period, making it possible to visually identify the area that should be preferentially handled in terms of QoE. We apply time-series prediction to predict future values for QoE-related information changes in time-series data based on their past values. These predicted values are used as inputs for QoE estimation, and the outputs are used for future QoE visualization and risk detection. 2.1 Data interpolationIn data interpolation, the characteristics of QoE-related information and/or its similarity to the surrounding area are considered. If the values of QoE-related information vary in accordance with the effect of congestion caused by increasing traffic, all terminals that received a radio signal from the same sector of the base station are affected by the congestion. Since traffic varies with time, the values representing the features of a specific period and specific area must be calculated from several QoE-related parameters measured in this period and this area. If the volume of measured data is not sufficient for a certain area and time, the data interpolation technique interpolates the values in that area and time, factoring in the variation tendencies in some directions (Fig. 3). Here, data interpolation using graph Fourier transform is applied as one method to achieve the data interpolation.
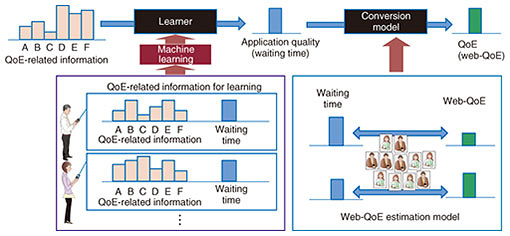
2.2 QoE estimationQoE estimation is based on the relationships between QoE and QoE-related parameters. We derive these relationships using two steps (Fig. 4).
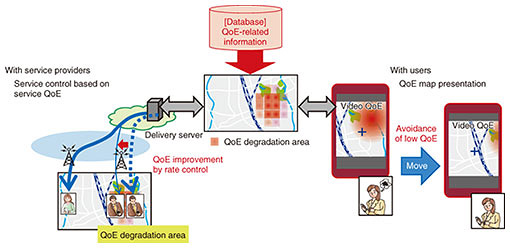
The first step is to derive the relationships between collected QoE-related information and application quality, which means the factors in the application layer that affect the QoE of the service. For example, the waiting time until a web page displays is the application quality of a web browsing service, and the video/audio bitrate and duration of a stalling event are the application quality of an audiovisual streaming service. When application quality is degraded in a terminal, many causes (e.g., weak radio received power, large interference or noise, traffic congestion, server or terminal in a high load state, or transmission characteristics of the terminal model) can be given as the reason for this degradation. To derive the relationships among them, we extract the parameters that can represent this effect quantitatively from collected QoE-related information, and we generate an input-output model by using machine learning. The second is to derive the relationships between application quality and QoE. We define this relationship by elucidating people’s perceptions or cognitive features. A subjective test or questionnaire is used to obtain data representing this relationship, and we generate a conversion model to analyze these data. 2.3 Time-series predictionTime-series prediction clarifies the characteristics of time-series variances in QoE-related information, the value of which varies over time. If crowdsourcing is used to collect QoE-related information, this information includes discrete data obtained from various user terminals, and time-series variances for each user terminal cannot be obtained. Thus, we quantify macro properties based on the value distribution for a specific period and specific area and clarify the characteristics of time-series variances based on these macro properties. 3. Utilization examples of QoE visualization and prediction modelQoE visualization on a map enables network operators to visually detect degraded areas on the basis of QoE and to identify preferential areas to focus on to optimize QoE when resources are limited. We are studying ways to utilize this information not only for network operation but also for achieving co-created quality (Fig. 5). Co-created quality is a concept in which a network operator cooperates with service providers or service users through a network to improve QoE. Utilization of QoE-related information provided from service providers or service users improves the accuracy of visualized QoE information, and this information is provided to service providers or service users. Service providers improve the value of their service by optimizing service parameters or notifying users in advance based on the visualized QoE information. Service users then take the optimal action (movement to high QoE area, selection of application) based on the visualized QoE information. Thus, we aim to create an environment in which every actor related to a network can improve QoE.
4. Future developmentWe introduced the concept of a QoE visualization and prediction model and its component technologies. We aim to construct a network that enables win-win relationships to be established among all players related to the network. We will continue working on ways to more efficiently utilize the output of the QoE visualization and prediction model in cooperation with service providers and service users to achieve optimum service provision. |