|
|||||||||||||||||||||||
|
|
|||||||||||||||||||||||
|
Regular Articles Vol. 18, No. 5, pp. 43–48, May 2020. https://doi.org/10.53829/ntr202005ra2 Operation-visualization Technology to Support Digital TransformationAbstractNTT Access Network Service Systems Laboratories (AS Labs) has developed various technologies to improve business operations using personal computers, for example, robotic process automation, annotation technology, and UI (user interface) augmentation technology. Based on this experience, we are researching and developing technologies useful for business-operation analysis. This article introduces the operation-visualization technology developed by AS Labs that supports objective/quantitative business-operation analysis. Keywords: digital transformation, operation analysis, data visualization  1. Operation analysis to promote DXDigital transformation (DX) means improvement through digital technology. In particular, business-operation improvement using digital technology is attracting the attention of many companies. NTT Access Network Service Systems Laboratories (AS Labs) has been working on technologies to improve business operations using personal computers (PCs). It developed the UMS (Unified Management Support System), which is a robotic process automation (RPA) technology [1], and NTT Advanced Technology Corporation is now selling it under the name of WinActor®*1 [2]. AS Labs is also working on annotation technology and UI (user interface) augmentation technology for improving operation performance that cannot be supported by RPA technologies (e.g., operations that are difficult to standardize and automate) [3]. NTT TechnoCross Corporation is now selling these technologies under the names BizFront/Annotation and BizFront/SmartUI*2, respectively [4, 5]. By introducing these technologies into NTT Group companies, AS Labs has clarified several issues when using the technologies in actual operational fields. In RPA, for example, automation personnel have to not only learn an RPA tool but also find automatable process flows or problematic operations from the target business operation to design automation processes for RPA. Ideally, field personnel who have business knowledge should learn RPA skills. Since this requires much time and effort, automation personnel having RPA skills and field personnel having business knowledge work together in many cases. In such a situation, automation personnel directly communicate with field personnel about the information needed to apply RPA. However, this is quite subjective, i.e., automation personnel cannot objectively and quantitatively analyze through only such communications. This issue is the same not only regarding RPA but also in business-operation-improvement activities such as business process management. These activities require objective/quantitative analysis methods as well as direct communication. Based on this knowledge, AS Labs is researching and developing various technologies for business-operation analysis.
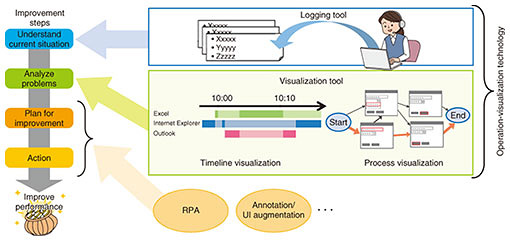
2. Operation-visualization technologyBusiness-operation improvement involves the following four steps: 1) understand current situation, 2) analyze problems, 3) plan for improvement, and 4) action, as shown in Fig. 1 (to increase efficiency, these steps should be repeated as a cycle). The operation-visualization technology AS Labs is researching and developing supports steps 1 and 2. This technology contains a mechanism for recording manipulations on a PC, which AS Labs has cultivated over many years, and original visualization methods newly developed by AS Labs.
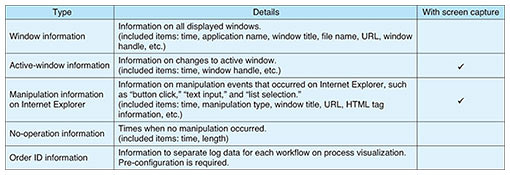
AS Labs is not only researching this technology but also developing software to be readily available for business operation. The software consists of two independent tools (executable files): logging and visualization. The logging tool is used on an operator’s PC and detects operation manipulations on the PC and records them in a log file. The visualization tool is used on an analyst’s PC to visualize the data of the log files to understand current operation and perform analysis. The visualization tool currently uses two visualization methods: timeline visualization and process visualization. With these tools, an analyst can obtain objective/quantitative data about PC manipulations and analyze the data from various viewpoints. As a result, an analyst can more effectively analyze business operations than through direct communication. 3. Logging toolThe logging tool is currently targeted for Windows 7 and Windows 10. It does not require installation and can be executed by simply unpacking to any folder on a target PC. During execution, the logging tool monitors the operator’s PC manipulations and records the data to a log file (text format). When detecting a specific manipulation, the logging tool capture a window’s screenshot and saves it in an image file. A folder for saving log/image files can be set freely (a shared folder on the network is also possible). If the size of the log/image files is too large, the operator can turn off the screen-capture function. A summary of the data the logging tool can record is shown in Table 1. Currently, the logging tool supports only Internet Explorer for manipulation-information recording, but AS Labs is considering support for Microsoft Edge and Google Chrome.
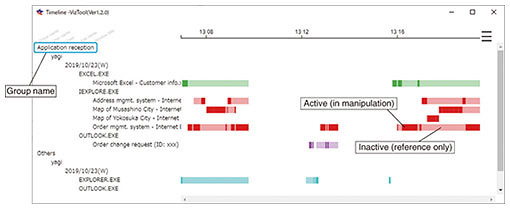
4. Visualization toolThe visualization tool loads log files recorded with the logging tool and displays current operations through timeline visualization and process visualization, respectively. The analyst can obtain the visualization results by loading log files for multiple days, multiple PCs, and multiple users at the same time and display these merged data. 4.1 Timeline visualizationTimeline visualization is a visualization method for analyzing window-level situations. A conventional visualization method visualizes only situations for active windows*3, but timeline visualization also displays situations for inactive windows [6]. Therefore, it is easy to analyze complicated business operations that use multiple windows, for example, working in a business system’s window while referring to a window displaying an operational manual. As shown in Fig. 2, timeline visualization displays a two-axis graph with time on the horizontal axis and window attributes on the vertical axis. A window attribute means the information-type of a window (application name, window title, loaded URL, loaded file name, PC name, user name, etc.) recorded using the logging tool. An analyst can freely select the types on the window-attribute axis to change the row order. The row order can be selected hierarchically by selecting multiple window-attribute types. Moreover, an analyst can select multiple window-attribute values and add a new group name to aggregate them into neighboring rows so that the analyst can focus on the selected window-attribute values. For example, in Fig. 2, timeline visualization is set to be displayed in this order: group name, user name, date, application name, and window title.
Timeline visualization then displays the window’s activity state as rectangles. A rectangle has darker and lighter shades of a color; darker shades indicate that the window was active and lighter shades indicate inactivity. The period with no rectangles indicates that the window did not exist or was not visible (a minimized window is regarded as not visible.). If multiple rectangles exist at the same time in the same value row on the window-attribute axis (e.g., the log data when an operator used multiple windows of the same application are visualized on the window-attribute axis of the application-name type.), the rectangles are shown as overlapping. If a darker rectangle of an active window overlaps a lighter rectangle, the darker rectangle is brought to the front. Timeline visualization has other features as follows.
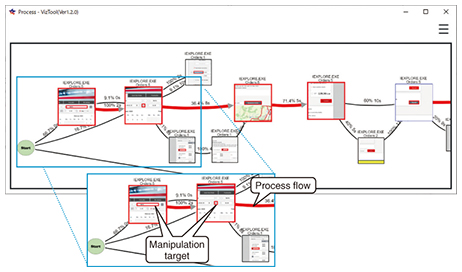
4.2 Process visualizationProcess visualization is a visualization method for more detailed analysis of the manipulation level than of the window level (e.g., button click, text input, list selection). This method displays a graph*4 of the manipulation flow recorded with the logging tool. This method is more efficient than the conventional visualization method because it has various filter functions to narrow the number of nodes, manual editing functions (grouping nodes and deleting unnecessary nodes), etc. [7]. As shown in Fig. 3, process visualization displays a directed graph on which nodes represent each manipulation and directed edges represent each transition of the manipulation(s). If log data contain multiple events of the same manipulation, process visualization makes multiple events a single node. To be intuitively understandable for an analyst, process visualization displays a related captured-screen image on the node and manipulation position by adding a red frame around the image (e.g., an external rectangle of a manipulated button). The logging tool can currently record manipulation-level events only on Internet Explorer, so an analyst can only analyze a manipulation-level situation regarding Internet Explorer with process visualization.
Process visualization has other features as follows.
5. Use example of operation-visualization technologyTimeline visualization enables the following analyses.
Process visualization enables the following analyses.
6. Future workAs Labs will use the operation-visualization technology in NTT Group companies with their cooperation. We will use the feedback obtained in the trials to further improve its practicability. We will also research and develop not only the current visualization functions but also an analytical function using various artificial intelligence technologies to support the implementation of RPA. Through these activities, we will further improve the technologies for business-operation analysis. References
Trademark notesAll brand, product, and company/organization names that appear in this article are trademarks or registered trademarks of their respective owners. |
|||||||||||||||||||||||