|
|||||||||
|
|
|||||||||
|
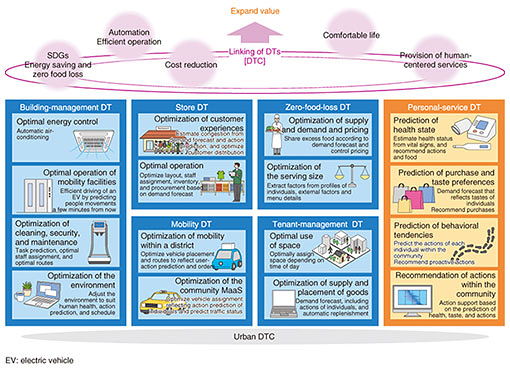
Feature Articles: Digital Transformation of Urban Areas Focusing on Mobility Vol. 19, No. 1, pp. 45–51, Jan. 2021. https://doi.org/10.53829/ntr202101fa7 Data-driven and Optimized Smart Cities Using Urban DTCAbstractUrban development assisted by information and communication technology has been attracting attention. For such development, it is necessary to promote, for example, advanced data usage, adapt to post-COVID-19 changes in lifestyle, and proactively prepare for diverse and fragmented lifestyles. This article describes NTT’s efforts to create new value through urban Digital Twin Computing, which is based on the Innovative Optical and Wireless Network (IOWN). Keywords: urban DTC, smart city, urban development  1. IntroductionTo make smart cities a reality, many activities using information and communication technology (ICT) are being undertaken around the world. There are different approaches to achieve this goal. In an infrastructure-centered approach, for example, the focus is on energy-management systems. In a sensing-centered approach, sensors are installed throughout a city to visualize data and provide services based on these data. The Society 5.0 initiative and a data-driven society, approved by the Cabinet Office, Government of Japan, in 2018, call for the creation of a super-smart society by integrating cyberspace and the physical space through the maximum use of ICT while balancing economic development and the resolution of social problems in a human-centered society [1]. As the ongoing pandemic is forcing changes to our lifestyles, there is a strong demand from users for increasingly diverse services. Therefore, it is necessary to provide services adapted to accommodate these changes. Conventionally, services have been provided separately in each industry. As services that span multiple industries emerge, value provided by services will become more varied than before. The NTT Group is working on urban Digital Twin Computing (DTC) in an attempt to provide new value by globally optimizing services provided in an urban community. It captures environments, objects, and people that are associated with each service provided in a community, creates their digital twins (DTs), and uses DTC [2] to link the DTs across different industries. By combining urban DTC with the 4D digital platformTM, which is being developed separately, we aim to create a data-driven and optimized smart city, which both enhances the value of services made available by service providers in a district and offers unprecedented experiences for service users. 2. Data-driven and optimized smart cities made possible by urban DTCUrban DTC is being developed in an actual urban redevelopment project in which the NTT Group is involved. By referring to discussions held among various providers who are pondering future urban development, we are studying how to achieve services that provide value, i.e., desired user experiences (UX), that are in line with future lifestyles and workstyles and undertaking technical development based on this study. For example, value-providing services (desired UX) for commercial and office functions can be classified into several categories: building management (building owners), store operation, tenant management, sustainable development goals (SDGs), and common means of mobility in the community (Fig. 1).
Implementation of these services requires the ability to predict the future by observing the state of each facility, people movement, as well as the surroundings of the district in real time. A technology for predicting the future by capturing people movements in a specific area as a mass (macroscopic approach) is currently being developed. If the movement of each individual can be captured (microscopic approach), it will be possible to precisely control the functions of the district [3]. Since multiple service providers, who influence each other, exist in a district, it is possible to expand the value of their services by linking and concatenating them. These services can be developed in the following steps:
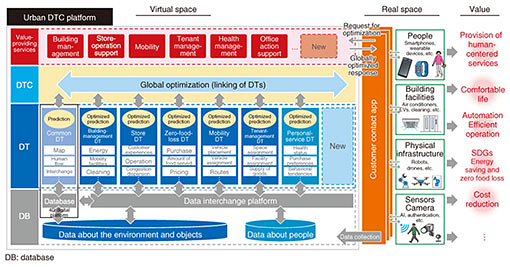
3. Architecture of urban DTCUrban DTC links DTs of the environment, objects, and individuals. The architecture of urban DTC can be represented, as shown in Fig. 2.
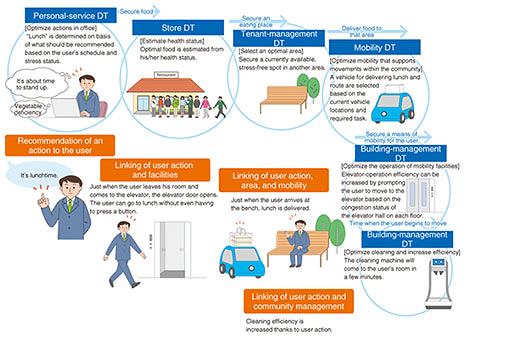
Data on the community and people are collected from sensors installed in the community and worn by individuals. Various types of system data within the community and external open data are also collected. The data-interchange platform stores collected data and converts their formats into the required formats. As well as data required by individual DTs, community datasets, such as maps, human flow, and traffic, which are commonly required by DTs, are also collected and given to DTs as necessary. DTs create a model of elements (people, objects, and environment) that are required when pursuing specific, real-world objectives (UX) and reproduces them in cyberspace. In cyberspace, predictions and optimizations are made using artificial intelligence (AI) and simulation. Urban DTC provides DTs, which operate in independent value-providing services, with functions that will be required when all segments of the community are taken into consideration. Global optimization is pursued so that new value can be created through linking DTs. Value-providing services control elements to reflect the results of optimization by DTs and DTC in the real world. The correspondence between the architecture of urban DTC and that of DTC described in the DTC white paper is as follows. The data-interchange platform and DTs in urban DTC correspond to the DT layer in the DTC white paper, and DTC in urban DTC corresponds to the digital-world-presentation layer. 4. Features of urban DTCThere are two main features of urban DTC: (1) value enhancement through linking DTs and (2) heightened prediction precision. 4.1 Feature 1: value enhancement through linking DTsAn example of a service that can be provided by concatenating DTs for community services is shown in Fig. 3.
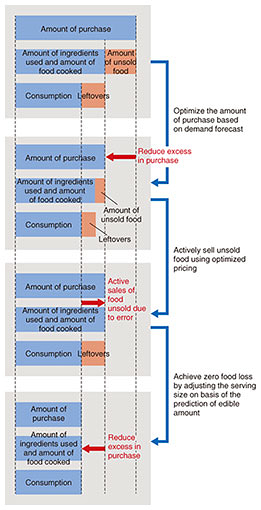
(1) A personal-service DT predicts that a particular worker will need to eat at a certain time from his/her vital signs and schedule. (2) A store DT and personal-service DT, linked to each other, select a dish good for the worker’s health from the restaurant’s menu. From the current and predicted congestion status of the restaurant, DTC determines that it is better for the worker to eat in another area than in this restaurant, requests a tenant-management DT to secure a spot in another area convenient for the worker, and requests a mobility DT to deliver food from the restaurant to that spot. DTC is aimed at global optimization covering several DTs, taking the worker’s comfort, congestion status of the current restaurant, and operation of the restaurant into account. (3) The personal-service DT predicts the worker’s health status from his/her collected vital signs and selects an area that is optimal for his/her health status and globally optimal for the community. (4) From the current locations of delivery vehicles and demand forecast, the mobility DT selects a vehicle most suitable for carrying lunch from the restaurant to the specified location. The selected vehicle goes to the restaurant. (5) The mobility DT collects information about the operational status of the elevator that the worker has to take to get to the specified area and predicts the best time when he/she should take the elevator from information about the predicted congestion status of the elevator. (6) A building-management DT finds from the operational status of security and cleaning that cleaning can be done efficiently if the worker moves within several minutes. Thus, the worker receives a suggestion at the right time that he/she should go and have his/her lunch. When he/she comes to the elevator, the elevator promptly arrives. Just when he/she arrives at the destination, food suitable for his/her health status is delivered. For user actions that involve multiple DTs, DTC can link DTs to provide highly satisfying UX, something that cannot be achieved by a single DT. 4.2 Feature 2: heightened prediction precision (regarding zero food loss)Another use of urban DTC is introduced below with an example of the zero-food-loss DT. In Japan, 28.42 million tons of food and foodstuff are thrown away annually, and a stunning 6.46 million tons is edible food loss [4]. They are thrown away because they are unsold, returned, leftovers, or non-standard. The following measures can be considered for restaurants in the community to reduce food loss (Fig. 4).
(1) Optimization of foodstuff purchase based on demand forecast Food loss at restaurants includes unsold food due to excessive production and disposal of ingredients because too much has been purchased. If demand can be forecast accurately and the amount of food purchased and the amount of food prepared are adjusted accordingly, both food loss and cost can be reduced. The prospective usage of restaurants in a community can be predicted from the trend of demand up to the previous day. (2) Active sales of unsold food by optimal pricing Even if demand can be forecast and the amounts purchased and produced are adjusted accordingly, an error may occur leading to unsold food. In other words, some food may unexpectedly remain unsold. Such unsold food can be actively sold by creating a salable state through optimal pricing based on real-time sales data and historical sales data (price, amount sold, etc.). (3) Zero leftovers by optimizing the serving size The largest proportion of food loss is the food left over from restaurant patrons. The main reasons for leftovers are excessive portions served by restaurants and too much food ordered by diners. It is necessary to consider means to avoid such excess. The serving size, type of dish, and amount of food ordered that results in leftovers can be predicted based on historical leftover trends and analysis of the amount of leftovers. The amount of leftovers can be reduced by adjusting the serving size, type of dish, and amount of food ordered according to the prediction. Measures (1)–(3) indicate what DTs can do to achieve a specific goal (desired UX), i.e., zero food loss in this case. In accordance with the steps followed by urban DTC, a prediction is made by taking into account the human flow in the community on a macroscopic level in Step 1. After that, in Step 2, the degree of precision of this prediction can be improved by predicting the purchase behavior of individuals using services that are provided to individuals rather than to groups of people. In Step 3, advanced services can be provided by concatenating DTs. For example, when a store DT is linked with a personal-service DT, it can predict the optimal serving size for an individual from his/her health status and what he/she has eaten, thus making it possible to focus on his/her health and reduce food loss at a stroke. 5. Future prospectsWe will take into account the interest of landowners and business operators in a community, set a specific goal (desired UX) for value provision that reflects current problems and future prospects, and create DTs and DTC, which enables interactions among DTs, required for achieving the goal. We will study DTs and DTC in more depth in actual community development initiatives. References
|
|||||||||