 |
|||||||||||||||||||||
|
|
|||||||||||||||||||||
|
Feature Articles: Urban DTC for Creating Optimized Smart Cities Attentive to the Individual Vol. 22, No. 5, pp. 102–109, May 2024. https://doi.org/10.53829/ntr202405fa13 Refining Solar-power-generation Plans to Achieve Stable Power Supply by Predicting Total Solar IrradianceAbstractTo reduce the environmental burden, it is necessary to adjust the supply and demand of electricity so that the proportion of renewable energy is increased. For solar-power generation, which is widely used, total solar irradiance is the main variable used in power-generation planning because it is strongly correlated with the amount of electricity generated. However, measurement and prediction of total solar irradiance produce values with large errors, leading to large errors in power-generation plans, which in turn cause problems in terms of stable power supply and the cost of adjusting supply and demand. In light of these issues, we developed a technology that combines weather information and power-generation results to predict total solar irradiance with high accuracy in a manner that makes it possible to refine solar-power-generation plans. Keywords: photovoltaics, power-generation forecast, total solar irradiance 1. IntroductionAs social and economic systems have been developed, technologies and services that respond to the diverse needs of individuals have been created, making it possible for people to lead rich social lives. However, the problems of global warming and climate change have become more apparent, and carbon neutrality has become a major theme. In September 2021, NTT Group formulated a new environment and energy vision, called “NTT Green Innovation toward 2040,” which aims to simultaneously achieve zero environmental impact and economic growth by “reduction of environmental impact through business activities” and “creation of breakthrough innovation.” Our major efforts to achieve carbon neutrality include “increased use of renewable energy” and “lower energy consumption with the Innovative Optical and Wireless Network (IOWN)” [1]. To expand the use of renewable energy, we will not only procure renewable-energy power sources from other companies but also develop and promote renewable energy such as photovoltaics (PV) within our own group and collaborate with partners and NTT Group companies [2]. To expand the use of renewable energy, it is essential to provide a stable supply of electricity. Renewable-energy sources are difficult to plan, that is, it is difficult to predict when, where, and how much power will be generated because the amount of power generated depends on natural conditions. Electric-power producers had been able to generate stable income from the sale of electricity under the feed-in tariff (FIT) system*1 without having to create a renewable-energy-generation plan, so they have been able to promote the development and use of renewable energy. However, with the introduction of the feed-in premium (FIP) system*2, electric-power producers are now required to create a renewable-energy-generation plan and trade their power in the electricity market and other markets on the basis of that plan. A variety of renewable-energy sources, such as hydropower, wind, and solar power, are available; however, in Japan, the use of PV is expanding, especially from the perspective of economic efficiency and environmental suitability (suitable locations). With PV, power generation (output) and total solar irradiance are strongly correlated; therefore, to draw up accurate power-generation plans, it is necessary to accurately measure and predict total solar irradiance. We first broadly discuss stable power supply, which is fundamental in regard to expanding the use of renewable energy. We then discuss the measurement and correction technology for total solar irradiance we developed to improve PV-output forecasting.
2. The necessity for a stable supply of electricitySimply put, to achieve a stable supply of electricity, the supply and demand of electricity must be perfectly matched to prevent power outages. If supply exceeds (or, conversely, subceeds) demand, various electrical products will malfunction and, in the worst case, power outages will occur. Accordingly, electricity utilities that support the electric-power system are obligated to make utmost efforts to ensure a stable supply of electric power. Japan has introduced a planned price coincidence system, under which power producers and retail electricity suppliers are obligated to match planned and actual electricity consumption in 30-minute increments per time block, and the system is operated so that the generation plan and demand plan coincide as a whole. The electric-power system shown in Fig. 1 is composed of a power producer, retail electricity supplier, and general electricity transmission and distribution company. The obligation to match plans and actual results is imposed on the power producer and retail electricity supplier, and if a discrepancy (imbalance) between their power-generation and demand plans and actual results unavoidably occurs, the general electricity transmission and distribution company will use its regulatory power to eliminate the imbalance. In this case, however, depending on the amount of imbalance, settlement is required at a later date, and the cost tends to be higher than when supply and demand are adjusted in an electricity market such as the spot (one-day-ahead) market or the hourly (same-day) market. It is therefore essential that the power producer and retail electricity supplier formulate accurate plans to avoid imbalances to reduce business risks and maximize profits.
The imbalance caused by the power producer is generally called the generation imbalance, while the imbalance caused by the retail electricity supplier is called the demand imbalance. As shown in Table 1, there are two types of imbalances, and the type depends on one of two imbalance situations. For example, if the actual power generated falls short of the generation plan, this situation is called a shortage imbalance, and the general electricity transmission and distribution company will make up the shortage and bill the customer for the amount of electricity generated at a later date. Conversely, if the actual power generated exceeds the generation plan, this situation is called a surplus imbalance, and the general electricity transmission and distribution company will purchase the surplus amount of electricity. In a surplus imbalance, the power producer appears to incur no loss; however, they do not know the purchase price until a later date and, in any case, they must pay compensation to the general electricity transmission and distribution company in accordance with the adjusted purchase amount. As mentioned above, it is thus essential for power producers and retail electricity suppliers to formulate accurate plans to avoid imbalances, reduce business risks, and maximize profits.
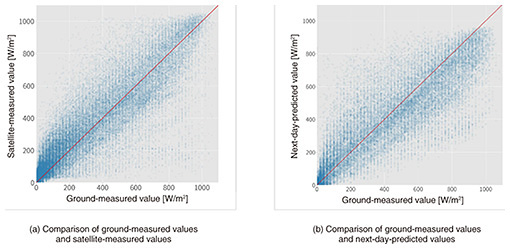
3. Challenges in predicting PV outputTo draw up accurate power-generation plans, it is necessary to accurately predict the amount of power generated. Renewable-energy sources, also known as naturally variable power sources, are subject to large fluctuations in power output due to factors such as weather conditions, seasons, and time of day. As for one of those power sources, PV output varies greatly with the intensity of the total solar irradiance falling on the surface of the PV panels. Basically, PV output can be accurately predicted if, in addition to the intensity of total solar irradiance, the effects of shadows caused by topography and buildings, the characteristics of the PV panels and power-conditioning system (PCS)*3, and any water droplets and dirt on the surface of the PV panels are known. However, current technologies and services for PV output forecasting have large errors, and each company is working to reduce these errors by incorporating various innovations in forecasting technology, establishing power-generation balancing groups, and reducing errors through renewable-energy aggregation. Efforts to control the generation imbalance by introducing grid storage batteries are also being made [3]. However, the smoothing effect of these measures is limited, and even if grid storage batteries are used, it is necessary to ensure that they have enough capacity to absorb the imbalance. From the standpoint of a power producer, it is a prerequisite that the generation imbalance be minimized to achieve cost benefits; therefore, it is essential to reduce errors in forecasted PV output, thus promote the introduction and expansion of renewable-energy sources. Errors in forecasted PV output are mainly due to errors in measured and forecasted total solar irradiance, so it is important to reduce those errors. Total solar irradiance is generally measured using meteorological satellites, and as shown in Fig. 2(a), there is a significant error between ground-based and satellite measurements. If the ground and satellite measurements agreed perfectly, all the points would be plotted on the red line; however, in reality there is a considerable error. Since total solar irradiance measured at ground level is the true value, it is desirable to be able to use the ground-level measurements. However, only about 50 meteorological observatories across Japan are equipped to measure ground-level total solar irradiance, which makes it impossible to measure total solar irradiance uniformly over a wide area. Technologies and services that use sunshine-duration data obtained from AMeDAS (Automated Meteorological Data Acquisition System) of the Japan Meteorological Agency to pseudo-measure total solar irradiance are available; however, total solar irradiance and sunshine duration are different parameters, and there are only 690 AMeDAS stations nationwide [4] that can measure sunshine duration. It is thus difficult to obtain accurate total solar irradiance for any given location. Two main models are used to predict total solar irradiance: numerical and statistical. Numerical models predict future total solar irradiance by calculating elements such as solar and atmospheric irradiation, cloud coverage, and aerosol concentration on the basis of physical laws. Statistical models predict future total solar irradiance by analyzing the relationship between total solar irradiance and other variables on the basis of historical measurement data and satellite images. Ensemble prediction models—which combine numerical and statistical models—and, more recently, deep-learning prediction models have been proposed [5]. However, total solar irradiance predicted by the currently widely used numerical forecasting models is generally calculated after predicting various meteorological factors such as cloud cover and atmospheric pressure, and as shown in Fig. 2(b), prediction errors in those factors lead to large errors in predicted total solar irradiance. The figure shows the relationship between the ground-measured total solar irradiance and the predicted (next day) values provided by weather companies. The errors shown here appear directly as errors in predicted PV output. To reduce errors in predicted PV output, we therefore constructed a high-quality PV-output prediction model by reducing measurement errors in total solar irradiance. The model reduces the prediction error in total solar irradiance and enables highly accurate prediction of PV output.
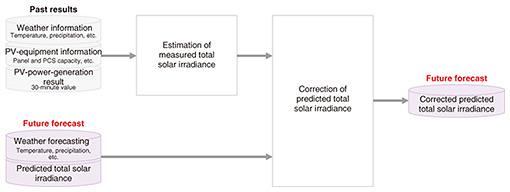
4. Measurement and correction technology for total solar irradiance by using PV outputAs shown in Fig. 3, this measurement and correction technology consists of two methods: estimation of measured total solar irradiance and correction of predicted total solar irradiance. These methods reduce the error between measured and predicted total solar irradiance.
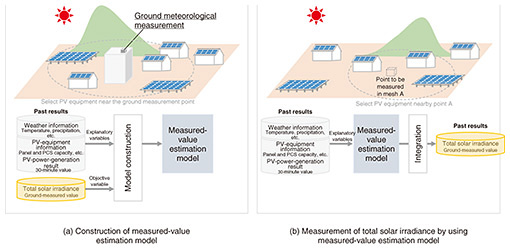
4.1 Estimation of measured total solar irradianceTo reduce measurement errors in total solar irradiance, it would be ideal to install pyranometers at high density on the ground; however, that method is not realistic owing to high installation and maintenance costs. Therefore, we use PV output—which can be monitored remotely—to measure total solar irradiance with high precision. Although technologies for measuring total solar irradiance by using PV output have been available for some time, they have not yet been developed into services because they only use PV-panel output and do not take into account the effects of neighboring buildings and topography as well as water droplets and dirt on the PV-panel surfaces. With the above-mentioned issues in mind, we proposed a method for measuring total solar irradiance with high accuracy by using meteorological information obtained at multiple locations, information about PV facilities, and power-generation records while indirectly taking into account the effects of neighboring buildings and topography. In regard to social implementation, we have started to provide the proposed method as a service to power-generation planners and others. As shown in Fig. 4, the proposed method has two phases: (a) construction of a measured-value estimation model and (b) measurement of total solar irradiance by using the measured-value estimation model.
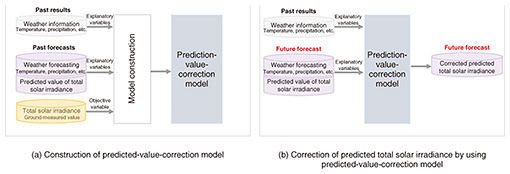
In phase (a), weather stations that measure ground-level total solar irradiance and PV equipment around our own measurement points are selected, weather information, PV-equipment information, and power-generation results are used as explanatory variables, the ground-level measurement of total solar irradiance is used as an objective variable, and a measured-value estimation model is constructed. For example, to improve the accuracy of the ground-level total-solar-irradiance measurements by taking into account the condition of water droplets and dirt on the surface of the PV panels, the amount of precipitation on the day of the measurements and the trend of PV output from several days before the measurement are incorporated as explanatory variables. Since PV output may not exceed the PCS capacity*4 and it may be uncorrelated with total solar irradiance, total solar irradiance can be accurately estimated—even when the PV output is at its peak—by incorporating PV output before and after the measurement period in the model as explanatory variables. In phase (b), the same explanatory variables as in phase (a) are used to incorporate various data at different locations and meshes*5 in the model as explanatory variables. Therefore, it is possible to estimate total solar irradiance equivalent to ground-based measurements at high accuracy even for locations where total solar irradiance is not measured at ground level. The performance of the proposed method was evaluated at ten sites around Japan (Hokkaido, Fukushima, Gunma, etc.), and the evaluation results confirmed that measurements made with this method have a 50% lower error rate than those made with conventional meteorological satellites. 4.2 Correction of predicted total solar irradianceTo reduce the prediction error of total solar irradiance, the error between the measured and predicted values of total solar irradiance in the past is analyzed, and the predicted total solar irradiance is corrected using the latest total solar irradiance at the forecast time. Predicted values of total solar irradiance, even when they are predicted one hour ahead of time, have large prediction errors. To reduce such errors, available technologies and services use the latest total solar irradiance measured using meteorological satellites to correct predicted values of total solar irradiance; however, the measured values of total solar irradiance contain large errors, and the corrections to those errors are not fully effective. We use the ground-level equivalent of total solar irradiance obtained with our measured-value estimation model to correct the predicted values of total solar irradiance. As shown in Fig. 5, this method includes two phases: (a) construction of a predicted-value-correction model and (b) correction of predicted total solar irradiance by using the model. In phase (a), the predicted-value-correction model is constructed from historical weather information, weather forecasts, and historical measurements and predictions of total solar irradiance. The correction of predicted values takes into account the following three factors: (i) the continuity of weather conditions, (ii) existence of region-specific weather characteristics, and (iii) tendency for predicted values to be lower than actual values.
For factor (i), for example, if the weather is currently cloudy, it is often cloudy for the next several hours. Accordingly, the error in predicted total solar irradiance can be reduced by correcting the total solar irradiance several hours in advance on the basis of the current total solar irradiance. For factor (ii), weather characteristics are regionally specific; for example, Kanagawa Prefecture has many sunny hours, while Akita Prefecture has few sunny hours. From another viewpoint, for example, the effect of altitude and topography can cause regional differences (of about 30 minutes) in the number of hours the sun is out, even within the same Tokyo metropolitan area. Corrections to predicted total solar irradiance that take into account such region-specific weather characteristics can reduce errors in the predictions. For factor (iii), predicted values may be lower overall than actual values due to the difference between mesh sizes used in the measurements and predictions. For example, for reasons related to the specifications of the numerical prediction model, a 1-km mesh is used for measurements, while a 5-km mesh is used for predictions. As a result, the predicted values may be lower than the actual values. The error can be reduced by taking into account and correcting for such deviations in values due to differences in mesh size. By considering the above three factors, it is possible to correct the predicted values of total solar irradiance so they become close to the actual values. In phase (b), the corrected future total solar irradiance can be obtained by inputting the latest (future) weather forecast into the correction model. This method has succeeded in correcting not only the predicted total solar irradiance several hours ahead on the same day but also the predicted total solar irradiance for the next day and the day after that. For these predictions, compared with conventional methods, this method reduced prediction error by about 25%, although regional differences in the effectiveness of the correction were observed.
5. Future developmentsTo make renewable energy a main power source, it is necessary to ensure a stable supply of electricity and reduce business risks. It is thus essential to reduce the power-generation imbalance that affects renewable energy. To reduce the error in predicted PV output, we proposed a method for estimating measured total solar irradiance and a method for correcting predicted total solar irradiance to reduce the error between the measured and predicted values of total solar irradiance, which is the main cause of error in predicted PV output. We confirmed the effectiveness of these methods in the field. However, we found that when the errors in predicted total solar-irradiance values provided by weather companies are large, correction with the proposed method was less effective in reducing the errors. With that issue in mind, we plan to investigate new prediction technologies that do not rely on predicted total-solar-irradiance values provided by weather companies. As well as researching forecasting of power generation, we are also pursuing research and development on using digital twins to optimize the entire supply-demand matching process by taking into account the supply and demand of electricity to enable a stable supply of electricity in a decarbonized society. Thus, we are contributing to the creation of a sustainable society. References
|
|||||||||||||||||||||


