 |
|||||||||||||||||||||||||||||||||||
|
|
|||||||||||||||||||||||||||||||||||
|
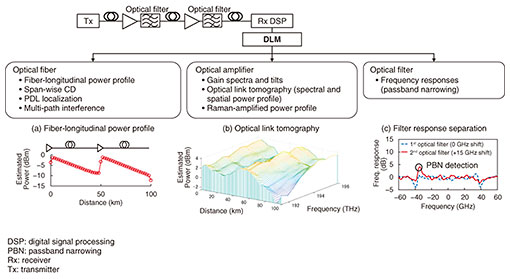
Regular Articles Vol. 22, No. 9, pp. 73–78, Sept. 2024. https://doi.org/10.53829/ntr202409ra1 Digital Longitudinal Monitoring of Fiber-optic Link Using Coherent ReceiverAbstractIn fiber-optic communication systems, it is crucial for operators to accurately monitor various physical parameters along optical links to fully leverage the potential transmission capacity and conduct fault analysis. Digital longitudinal monitoring (DLM) has been intensively studied for its capability of monitoring various physical parameters, such as optical power, distributed along the fiber-longitudinal direction by solely processing signals received at coherent receivers. In this article, the fundamentals and recent advances in DLM are reviewed, including working principles, spatial resolution, and key experiments demonstrating its feasibility for use in operations. Keywords: digital longitudinal monitoring, digital coherent receiver, fiber nonlinearity 1. IntroductionOptical networks are becoming increasingly complex due to trends such as disaggregation, dynamic provisioning, and ultra-wideband transmission. To fully leverage the potential capacity and maintain these advanced networks efficiently, it is crucial for operators to monitor the physical parameters of the entire link, including optical power and locations of loss anomalies. Digital longitudinal monitoring (DLM), which has been studied intensively, estimates various physical link parameters distributed in the fiber-longitudinal direction solely by processing signals received at a digital coherent receiver (Fig. 1). Demonstrated monitored parameters include the longitudinal optical power profile [1–7], span-wise chromatic dispersion (CD) map [2], amplifiers’ gain tilt [2, 8], optical filter detuning [2], polarization dependent loss (PDL) [9–11], multi-path interference [6], and spectral and spatial power monitoring called optical link tomography over C [2], C+L [8], and S+C+L [12] bands. DLM enables the localization of multiple anomalies over multi-span links without the need for dedicated hardware devices such as optical time domain reflectometers (OTDRs) and optical spectrum analyzers, thus reducing installation costs of these devices. Longitudinal power monitoring (LPM) is of particular importance since optical power determines the generalized signal-to-noise ratio (SNR) and its distributed measurement allows the localization of loss anomaly, both of which facilitate network management and control. Various demonstrations of LPM have showcased its capabilities, including a precise LPM closely matching the OTDR [4], demonstrations over 10,000 km [5], LPM using commercial transponders [7], and field experiments [13].
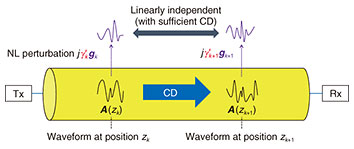
The primary challenge with DLM is that it relies on the fiber nonlinearity, and high fiber launch power is necessary to achieve sufficient accuracy, which causes a quality of transmission (QoT) degradation in adjacent wavelength division multiplexing (WDM) channels due to excessive nonlinear interference (NLI). Most demonstrations used optical power far higher than the optimal operational point. We recently demonstrated LPM under system optimal launch power and WDM conditions with sufficient accuracy to locate several loss anomalies in field-deployed fibers [13]. In this demonstration, we also showed four-dimensional optical link tomography, which visualizes optical power not only in the distance direction but also in the time, frequency, and polarization, allowing for the localization of multiple QoT degradation causes such as PDL, spectral tilt, and time-varying power anomaly (e.g., fiber bending loss). In this article, the fundamentals and recent advancements in DLM are reviewed, with a particular focus on LPM, including the localization principle, an inherent limitation on spatial resolution (SR), algorithms, and several key demonstrations of DLM. 2. Working principleLPM estimates the fiber-longitudinal optical power P(z) from received waveforms by extracting the nonlinear phase shift γ'(z) = γ(z)P(z) that the signals experienced during the fiber transmission, where γ(z) is the fiber nonlinear coefficient at position z. The key mechanism for the localization of the optical power is the interaction between fiber nonlinearity and CD in optical fibers [3]. To elucidate the localization principle, let us consider the regular perturbation model for the fiber nonlinear propagation. In the first-order regular perturbation, the additive NLI jγ'(z)|A(z)|2 A(z) is excited at each position on fibers, which is dependent on the original signal waveform A(z) (see Fig. 2). Such local NLIs propagate to the receiver, undergoing the remaining CD
The total NLI at the receiver is the accumulation of the received local NLIs and represented as
which shows that {g(z)}z form a basis of the total NLI. Two of these basis vectors g(z) and g(z + Δz), separated by a distance Δz, are linearly independent in the presence of sufficient CD, allowing the corresponding γ'(z) to be extracted at the receiver. The qualitative understanding is that sufficient CD alters the original signal waveforms during the propagation, and the excited NLIs at different locations are thus unique and distinguishable upon reception.
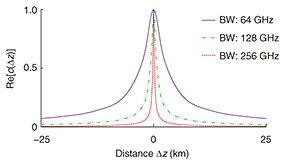
3. Spatial resolutionOne straightforward approach to extract the expansion coefficient γ'(zk) at position zk (k ∈ [0, K – 1]) is to take the inner product of A1(L) and the corresponding basis vector gk = g(zk). However, the basis {g(z)}z is not orthogonal: the resulting inner product
which is called the spatial correlation function (SCF) or spatial response function [3, 14]. Here, BW is the bandwidth of the signal. Figure 3 shows the SCF for various BWs. The SCF has a ‘width’ with long tails, suggesting that the estimated γ'(zk) values contain contributions from neighboring positions. This means that there is an inherent uncertainty in determining the position of loss events, limiting the SR of LPM. By defining the SR as the full width at half maximum of the SCF, obtain
indicating that the SR is enhanced with an increased CD and BW [3].
4. MethodsThe simple inner-product approach described above is called the correlation method (CM) [1, 3, 6]. However, due to the non-orthogonality shown in the SCF, the entire output of CM G†A1 = [g0, g1, …,
where λ is a regularization parameter and I is the identity matrix. This method generalizes CM and LS as it approaches CM for λ → ∞, while it becomes LS for λ = 0.
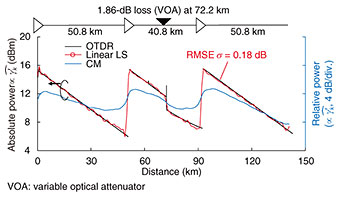
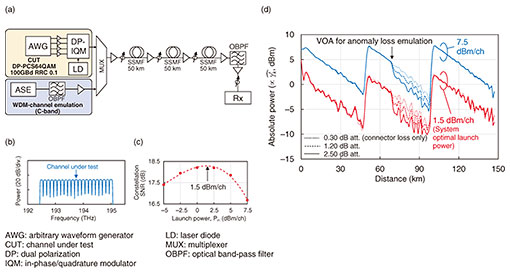
Although most LPM demonstrations have used self-channel interference, cross-channel interference (XCI) or cross phase modulation can also be used to localize power events [15–17]. Although XCI-based methods require an access to two channels and their timing synchronization, they achieve high SR due to a large walk-off between two channels. 5. Experimental demonstrationsFigure 4 shows an experimental demonstration of LPM using the LS estimation [4], which achieved precise estimation. This experiment used probabilistically constellation shaped (PCS) 64 quadrature amplitude modulation (QAM) with a roll-off factor of 0.1 and symbol rate of 100 GBd. The link under test was a 142.4-km 3-span standard single-mode fiber (SSMF) link with a 1.86-dB attenuation inserted at 72.2 km. The fiber launch power was set to 15 dBm/ch. While the CM (blue) reflects the overall power trend, it fails to align with the OTDR and is less sensitive to the loss anomaly due to the convolution effect. On the other hand, the LS demonstrated a closer match with the OTDR, having a root mean square error (RMSE) of 0.18 dB and maximum absolute error of 0.57 dB. Figure 5 shows the LPM experiment under the system optimal launch power and WDM conditions [4]. The WDM channels were loaded from an amplified spontaneous emission (ASE) source, shaped using an optical filter, with the channel under test set at the center of the WDM channels (Figs. 5(a)(b)). The optimal power was around 1.5 dBm/ch (Fig. 5(c)). As shown in Fig. 5(d), LPM showed superior performance with high power (blue). However, the estimated power profiles at 1.5 dBm/ch are still clearly visible, enough to locate a loss anomaly. The RMSE from the OTDR prior to the loss event was σ = 0.20 dB, and we set the detection threshold of 4σ = 0.80 dB. Since an inserted loss of 1.20 dB exceeded the threshold, LPM successfully detected the 1.20-dB loss anomaly and can potentially localize a 0.80-dB loss. These results indicate the feasibility of LPM for use in system operations.
6. SummaryIn this article, the fundamentals and recent advancements in LPM are reviewed. Recent intensive efforts have led to significant progress, such as a precise LPM that closely matches the OTDR, the feasibility demonstration at operational launch power, and adapting LPM for use with commercial transponders. To achieve more reliable performance for deployment, future research should include (i) improving noise and distortion robustness for enhanced accuracy at operational optical power levels, (ii) developing lightweight algorithms, and (iii) enhancing functionality for monitoring a wider range of link parameters. References
|
|||||||||||||||||||||||||||||||||||

