|
|||||||||||||||||||||||||
|
|
|||||||||||||||||||||||||
|
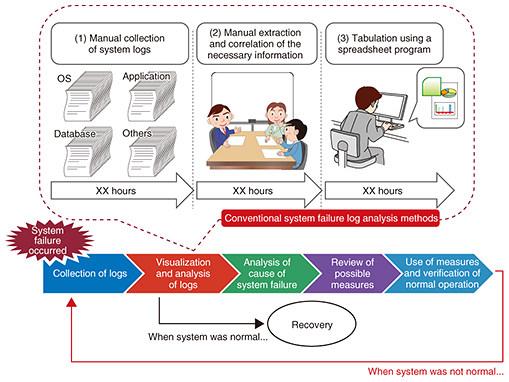
Feature Articles: OSS Activities in Era of Internet of Things, Artificial Intelligence, and Software-defined Everything Vol. 16, No. 2, pp. 48–53, Feb. 2018. https://doi.org/10.53829/ntr201802fa8 Achieving Greater Work Efficiency in Systems Failure Analysis Using Elastic StackAbstractThe keys in analyzing serious system failures are collecting information and logs in various formats, extracting the necessary information from the collected logs, and analyzing the correlated items; however, such procedures are time-consuming. NTT Comware is working on reducing the work time and simplifying the procedure by using Elastic Stack. This article introduces the details of the method and some future scenarios. Keywords: log analysis, Elastic Stack, metrics analysis  1. Strategic objective for improving the efficiency of system failure log analysisThe procedure for analyzing logs in the event of a serious system failure should include carrying out various analysis tasks on the operating system (OS), applications, and database, rather than simply logging records of applications of the system concerned (which also must be done). Such log records contain various kinds of information in their own formats. It is also necessary to extract the necessary information from massive amounts of data—from several thousand megabytes (several thousand lines) to tens of thousands of gigabytes (several tens of thousands of lines) of data—and correlate them for analysis in the log visualization/analysis process. In the conventional method, as shown in Fig. 1, these operations are conducted manually, including tabulation using a spreadsheet program, which requires additional man-hours.
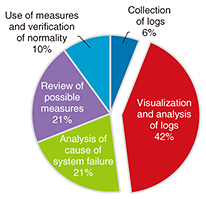
This log visualization/analysis work accounted for 42% of the total system failure log analysis in a certain system failure handled by NTT Comware, as shown in Fig. 2. Therefore, achieving higher efficiency in this task is a major challenge for reducing the time from the occurrence of the system failure to recovery. Under these circumstances, we are currently introducing initiatives to reduce the overall work hours by achieving higher efficiency of log visualization work and analysis in the system failure log analysis process.
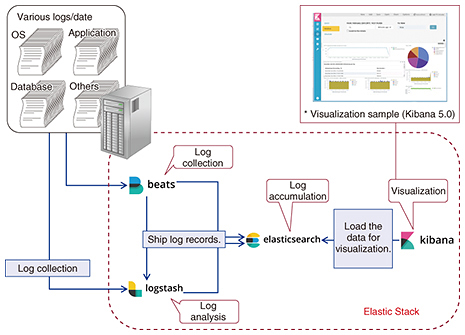
2. Approach to achieve highly efficient log visualization/analysisWe have been working on a way to increase work efficiency by using Elastic Stack, which we describe in this section. 2.1 Elastic StackElastic Stack is a combination of the following open source software (OSS): Beats*1, Logstash*2, Elasticsearch*3, and Kibana*4, the development of which is led by Elasticsearch Co. [1]. This is an example of a data analysis infrastructure that has been gaining attention recently for its use in the collection, accumulation, and/or visualization of big data. The general architecture of Elastic Stack is shown in Fig. 3.
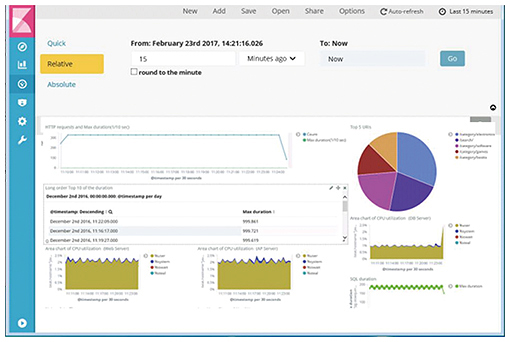
Each tool in Elastic Stack has a function, for example, log collection (Beats), log analysis (Logstash), log accumulation (Elasticsearch), and visualization (Kibana). The combination of these tools enables advanced visualization of data in formats, including time series graphs, pie charts, and statistical information. 2.2 Advantages of Elastic StackAlthough many tools other than Elastic Stack have been released as infrastructure tools for collecting/accumulating/visualizing big data, we needed to select the optimum tool that would have the following required capabilities in this initiative: (1) Collection and analysis of multiple logs in different formats (2) Correlation of specific items among accumulated logs and simultaneous visualization of multiple logs (3) Continuous log monitoring Requirements (1) and (2) are essential since they are included in the necessary work to do in the process of log collection and analysis, as mentioned in section 1. Requirement (3) is also defined as one of the requirements that need to be met in order to promptly cope with a system failure, since it is necessary to collect, analyze, and visualize the latest logs on a real-time basis. As a result of a comparative study done on similar infrastructure tools, Elastic Stack was selected since it easily meets the above requirements in terms of functions. It also has an active development community. Furthermore, since Elastic Stack is OSS, there were no initial costs to use it such as for license fees. This was also one of the reasons it was selected. 2.3 Efficient log visualization/analysis methodNTT Comware has documented a system failure log analysis procedure that explains how to achieve efficient log visualization and analysis. Failure analysis engineers, application developers, and operations managers can use this document to visualize OS/application/database logs using Elastic Stack and to reduce the working time to determine a suspected cause of failure. The document has three sections as follows. (1) How to Install Beats, Logstash, Elasticsearch, and Kibana It is necessary to construct a system environment that facilitates use of the method, such as by installing each tool in Elastic Stack. This section explains how to install each tool to simplify this work process. (2) Collection and Visualization/Analysis Procedure for Various Logs This section summarizes the procedure to collect OS/application/database logs using Beats and Logstash, store them in Elasticsearch, and visualize them using Kibana (Fig. 4). The settings described in this document are based on OSSVERTTM (OSS Suites VERified Technically)*5 provided by the NTT OSS Center. The settings can be used as they are in systems that have settings that conform to OSSVERTTM.
(3) How to Back Up and Restore Data Stored in Elasticsearch When the system environment is constructed based on the above two steps, and log visualization/analysis continues, it is important to avoid reducing the storage capacity with the accumulated logs and to prepare the procedure to restore the log records in case of a malfunction of the disk that stores the logs. This section describes how to back up and restore the log records stored in Elasticsearch. 2.4 Results of efficient system failure log analysis method using Elastic StackWe are implementing the abovementioned system failure log analysis procedure at NTT Comware and promoting such analysis methods using Elastic Stack having the same architecture shown in Fig. 3. The results of the implementation revealed that the cost of the complicated system failure log analysis was reduced to about one-twentieth (1/20) on average by using the method. The following highlights a successful case in which the amount of time spent analyzing system failure logs was reduced. In this example, system failures were occurring that frequently showed high central processing unit (CPU) usage. The method was applied to analyze the system failure logs, and it was found that the surge in the CPU usage rate was due to unnecessary UNIX commands input by the operator. With conventional system failure log analysis methods, it would typically take ten working days to confirm normality because of the large size of the log records, often many gigabytes. In contrast, this method contributed to quick troubleshooting, since the time to complete the whole process was shortened to about four hours. 2.5 Additional knowledgeNTT Comware provides other knowledge necessary for applying Elastic Stack at the company, in addition to the abovementioned system failure log analysis procedure. The key points are as follows. (1) Elastic Stack Sizing Test Report/Elastic Stack Sizing Guide It is essential to carefully consider the size and design of the system in order to apply the system failure log analysis method using Elastic Stack with commercial systems handling massive amounts of log records or in systems that are significantly larger than usual. Therefore, NTT Comware tested the sizing of the system that uses Elastic Stack and documented the results in the Elastic Stack Sizing Test Report/Elastic Stack Sizing Guide. This document summarizes the guidelines of the hardware environment to procure when designing the log analysis mechanism such as the basic performance and the scalability of Elastic Stack. (2) Elastic Stack/Splunk Comparison Survey Report When Elastic Stack is proposed for use, it may be a requirement in some cases to first conduct a comparative survey and obtain results on other similar tools, including commercial products. Since a comparative survey report on Splunk*6 [2] is often requested when making proposals (to our customers), we provide to them the Elastic Stack/Splunk Comparative Survey Report, which summarizes the comparative results in terms of functions (i.e., ease of learning, adaptability, and expandability) and performance of Splunk and Elastic Stack. The documentation makes it possible to further understand the characteristics of Elastic Stack and Splunk and to easily select appropriate products for customers.
3. Application support experience and future plansElastic Stack can be used for visualization and analysis of not only system failure logs but also regular task logs in commercial systems by applying the method/knowledge of this initiative. NTT Comware has been involved in 22 Elastic Stack deployment projects up to August 2017 and is promoting optimal system development utilizing advanced OSS-based technologies. We are continuing to accumulate product knowledge on Elastic Stack since version upgrades and new function updates are essential for application of the efficient system failure log analysis method at our company. Furthermore, because we need more specific knowledge on Elastic Stack when used in combination with OSS such as Apache Kafka*7 [3] and Apache Spark*8 [4] to process large-scale data, we are also accumulating knowledge on these and other types of software. They have often been used in projects to create a log analysis infrastructure, a trend that has been increasing in recent years.
References
Trademark notesElasticsearch, Logstash, and Kibana are trademarks of Elasticsearch BV, registered in the United States and in other countries. Beats is a trademark of Elasticsearch BV. Apache, Apache Kafka, and Apache Spark are trademarks of the Apache Software Foundation, registered in the United States and other countries. Other brand names, product names, and company names that appear in this article are trademarks or registered trademarks of their respective owners. |
|||||||||||||||||||||||||