 |
|||||
|
|
|||||
|
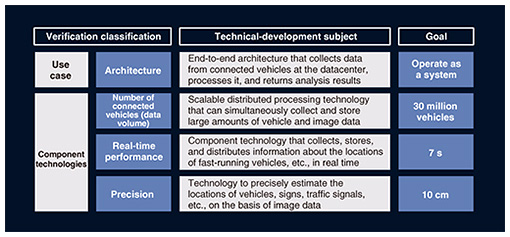
Feature Articles: ICT Platform for Connected Vehicles Created by NTT and Toyota Vol. 20, No. 7, pp. 42–47, July 2022. https://doi.org/10.53829/ntr202207fa6 Activities and Results of Field Trials—Reference Architecture for a Connected-vehicle PlatformAbstractThe NTT Group and Toyota Motor Corporation are collaborating on research and development of an information and communication technology platform for connected vehicles. They conducted joint field trials and verified the platform across a variety of use cases from 2018 to 2020. They also established basic technologies in the course of these trials. This article presents an overview of the reference architecture for the connected-vehicle platform, which collects, stores, and uses controller area network data (vehicle control data) and image data sent from in-vehicle devices. It also reports on the technical results obtained and challenges identified during the implementation of the platform and the field trials. Keywords: connected vehicles, IoT, big data 1. Characteristics of connected vehicles and technical challenges they poseAs the number of connected vehicles grows rapidly, the amount of data obtained from them, such as controller area network (CAN) data, sensor data, and image data, is growing dramatically. How to process this enormous amount of data efficiently and in real time presents a major technical challenge for a large-scale connected-vehicle platform. Connected vehicles also have several unique characteristics: they need to use a mobile network for communication; move at high speed; have a long life cycle; and the amount of data to be handled varies greatly from hour to hour even within a single day. Therefore, using connected-vehicle data across a variety of use cases poses many complex technical challenges. The NTT Group and Toyota Motor Corporation are collaborating on research and development of an information and communication technology platform for connected vehicles. In conducting field trials to verify this platform, we set our goals from the perspectives of three particularly important component technologies: the processing of a large amount of data, real-time performance of the processing of such data, and the degree of precision in the data processing. We have thus studied a connected-vehicle platform that can work across various use cases of connected vehicles and automated driving (Fig. 1).
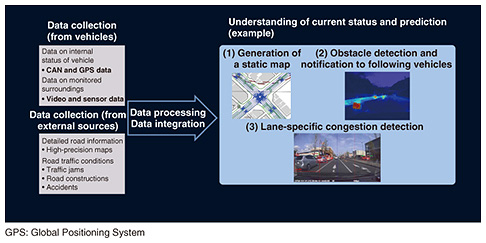
2. Use cases for the field trialsThe field trials were conducted using test vehicles on public roads for three years from 2018 to 2020. The main objective of these trials was to establish the technologies for and evaluate the performance of a large-scale platform that will be able to handle millions of connected vehicles in the future. We verified the platform using the following three sample use cases, which are likely to be put into practice (Fig. 2). (1) Generation of a static map: The datacenter analyzes vehicle-location data and image data sent from connected vehicles and generates a high-precision static map required for automated driving. (2) Obstacle detection and notification to following vehicles: Dangerous obstacles, such as falling rocks on the road, are detected using image data from cameras mounted on connected vehicles. The datacenter manages this information and notifies the following vehicles of danger. (3) Lane-specific congestion detection: Both recurring and non-recurring traffic jams on each lane are detected using statistical information in CAN data and real-time image data. The cause of a non-recurring traffic jam is identified by analyzing images of the front point of the traffic jam.
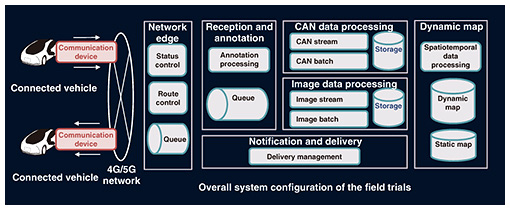
We evaluated the feasibility of these three use cases through the field trials. Among the component technologies needed for a large-scale connected-vehicle platform, we focused on the above three component technologies and set the following goals: the processing of large amounts of data, real-time processing of such data, and the degree of precision in the data processing. 3. Reference architecture for the connected-vehicle platformData from connected vehicles are collected via wireless networks (LTE (Long-Term Evolution) network and the 5th-generation mobile communication system (5G) network) and stored in servers in datacenters. The data are analyzed, and analysis results are sent back to connected vehicles. We incorporated this end-to-end system into the reference architecture for the connected-vehicle platform. This reference architecture consists of six platforms: a network-edge computing platform, which has a real-time link with connected vehicles, a reception and annotation platform, which receives data from edge computing nodes, CAN data processing platform and image data processing platform, both of which process data, dynamic map platform, which manages data, and notification and delivery platform, which manages communication from datacenters to connected vehicles. We implemented this architecture using open-source software programs that had become de facto standards in the global market. The goal of this collaboration is to develop technologies that will lead to standardization with a policy of establishing technologies that are more open and not dependent on the proprietary software of a specific company. Therefore, the software is structured in such a way that it can be revised as technology advances and innovations emerge (Fig. 3).
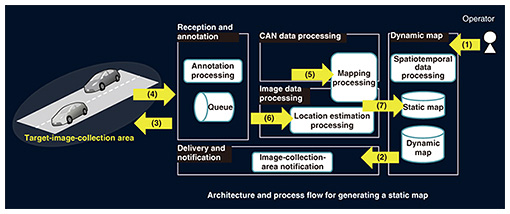
4. Verification of use casesA server environment for the field trials was implemented in a datacenter based on the reference architecture described above. The feasibility of the following three use cases was verified using test vehicles. (1) Generation of a static map In this use case, an operator at the datacenter first sends an instruction to connected vehicles to generate a map. When a connected vehicle running in the target area receives the instruction, it sends CAN data and image data to the datacenter. The datacenter executes preprocessing for generating a map from the image data, estimates the locations of traffic lights and other objects from the image data, generates map data, and registers the data in the map database. We verified all these processes (Fig. 4).
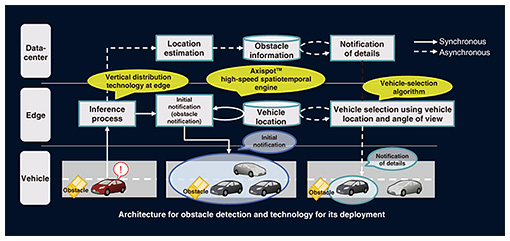
(2) Obstacle detection and notification to following vehicles In this use case, the datacenter uses image data from onboard cameras and learned obstacle data to infer an object in images. If the object is an obstacle, its location is estimated and registered in the dynamic map database. A challenge in this use case is real-time performance. For this to be practical, it is necessary to detect an obstacle and notify the vehicles approaching in the rear of it within 7 seconds. We adopted an architecture that offloads parts of this processing to the network-edge computing nodes, which greatly improved real-time performance. We further improved this performance by sending danger notifications in two stages. The first notification is sent promptly to the vehicles in a wider area without taking time to narrow down the affected area. The vehicle in danger in a specific lane is then identified and a second notification is sent to that vehicle (Fig. 5).
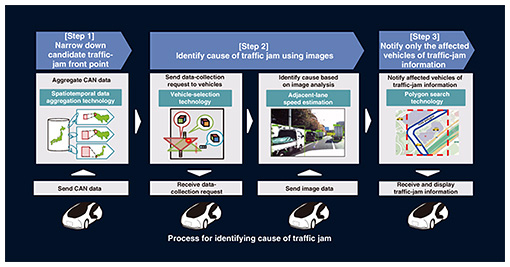
(3) Lane-specific congestion detection In this use case, the datacenter identifies the cause of a traffic jam in three steps. In Step 1, the datacenter analyzes CAN data of running vehicles in real time and narrows down the candidate traffic-jam front point on the basis of vehicle density per mesh and per lane. Recurring traffic jams are excluded because their causes can be identified in advance; thus, we focused on non-recurring traffic jams. In Step 2, the datacenter collects image data from the vehicles running in the vicinity of the potentially congested lane identified in Step 1. Using the image data, the datacenter determines whether there is a traffic jam, its location, and its front point, and identifies its cause. In Step 3, the datacenter notifies the vehicles running in the affected lane of the cause of the traffic jam obtained in Step 2 (Fig. 6).
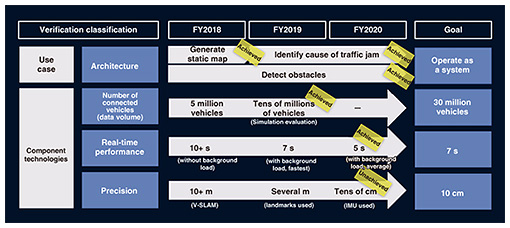
5. Verification of the platforms of the reference architectureWe evaluated the following platforms of the reference architecture. (1) Reception and annotation We evaluated this platform by focusing on the performance limits of CAN data and image data processing. Specifically, we evaluated the load performance of annotation processing and queuing processing and identified bottlenecks under a simulated condition in which 5 million vehicles were sending data at intervals ranging from a minimum of 1 second up to 10 seconds. (2) CAN data processing We evaluated this platform in terms of real-time performance and throughput. We implemented real-time processes, such as the regular storage of vehicle location information, through CAN stream processing and evaluated the performance limit of their respective response times. (3) Image data processing We evaluated this platform in terms of real-time performance and throughput. We implemented real-time image processes, such as obstacle detection, through image stream processing and evaluated the performance limit of their respective response times. (4) Notification and delivery processing We evaluated this platform in terms of the cost of image collection, which can become a bottleneck in each use case. An algorithm for selective collection of vehicle data, which was developed by NTT, was used to reduce the amount of image data collected. We evaluated the performance of communication infrastructure technologies assuming that this algorithm was used. The verification of the network-edge computing platform is not described here because it is described in another article in this issue: “Activities and Results of Field Trials—Network Edge Computing Platform” [1]. 6. Issues identified and future activitiesWe verified the reference architecture for three sample use cases using test vehicles running on public roads. In evaluating the communication infrastructure technologies needed for a large-scale connected-vehicle platform, we set goals for data volume, real-time performance, and precision (Fig. 7). Regarding data volume, we used simulation data and successfully verified that the data processing platform can handle 30 million vehicles. Regarding real-time performance, we used network-edge computing and achieved an average notification time (time taken before sending notification) of 5 seconds (the target was within 7 seconds) in the obstacle-detection use case. We attempted to improve precision by using visual simultaneous localization and mapping (V-SLAM)*, landmark location information, and an inertial measurement unit (IMU). Despite these efforts, we were not able to achieve our target of 10-centimeter precision. This will be an issue for future technological development.
While we achieved our initial goals, except for precision, we also identified a number of technical issues. The collection, storage, and utilization of large amounts of image and other data impose a heavy burden on networks and server resources. For these technologies to be implemented in society, it is necessary to develop technologies that are not only functionally feasible but also more efficient and less expensive. To achieve these targets, we are developing technologies that use edge computing to distribute processing loads and use resources efficiently. We will also expand the application of these technologies to cases in which they can address social issues, such as contributing to a low-carbon society, a contribution that is particularly expected of the automobile industry.
Reference
|
|||||

