Feature Articles: Exploring the Nature of Humans and Information for Co-creating Human-centered Technologies with AI
1. Data analysis for large-scale data
Interest in data science has surged. One sign of this trend is the Harvard Business Review’s 2012 introduction of data scientists as “the sexiest job of the 21st century.” Many companies actively use data science, and numerous universities are now dedicated to cultivating talent to support this field. This trend has intensified annually, highlighting the growing importance of data science. One reason for the heightened interest is that companies can enhance business value by deriving effective marketing strategies from data analysis. The Economist’s article, emphasizing data’s value with the phrase “data is the new oil,” also contributed to the widespread recognition of data analysis’s importance.
The volume of digital data, which is the subject of data analysis, has been increasing rapidly. According to market research reports, the amount of digital data, which was approximately 12.5 zettabytes (around 1.25 billion terabytes) in 2014, is predicted to reach about 181 zettabytes (around 18.1 billion terabytes) by 2025. Extracting patterns and trends from such a vast data pool to support human decision-making is essential for effectively using this new resource called data. However, a significant challenge is that data analysis on such a massive scale incurs enormous computational costs due to the complexity of data analysis.
Approximate computation is seen as a reasonable way of reducing such computational costs. However, approximate computations emphasize speed over precision, resulting in a trade-off between computation time and analysis accuracy. Therefore, reducing computation time lowers analysis accuracy, and improving accuracy increases computation time. Since data analysis is used to support human decision-making, degrading the rigor of analysis results is not desirable.
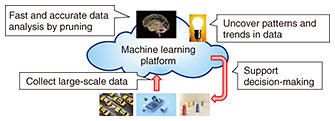
My research colleagues and I are advancing research and development activities to build a machine learning platform that achieves both speed and rigor in data analysis (Fig. 1). A key to this platform is computational pruning. Computational pruning accelerates processes by eliminating unnecessary computations without compromising the accuracy of the results. This article introduces three representative pruning methods: (1) omission of computations using upper and lower bounds, (2) termination of computations that cannot yield solutions, and (3) fast computations through optimistic processing.

Fig. 1. Machine learning platform.
2. Omission of computations using upper and lower bounds
First, I introduce a pruning method that uses upper and lower bounds to omit computations. This method rapidly identifies unnecessary processes by using upper and lower bounds of scores to skip unnecessary computations. An example of this pruning method is the acceleration of CUR matrix decomposition.
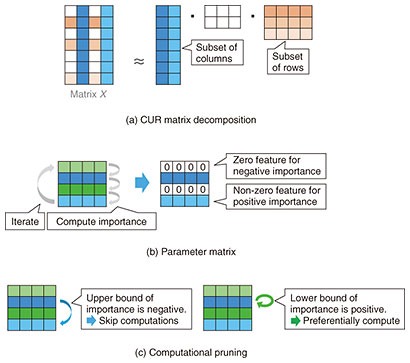
CUR matrix decomposition decomposes a given matrix X using its subsets of rows and columns (Fig. 2(a)). In Fig. 2(a), matrix X has the size of 7 × 4, and in CUR matrix decomposition, this matrix is represented using two blue subsets of columns and three orange subsets of rows. CUR matrix decomposition can extract important features from high-dimensional data by finding characteristic subsets of rows and columns that well represent the given matrix. For instance, time-series data generated over long periods from high-functioning sensors in a
factory can be represented as a matrix of sensor count × time length, resulting in a very large number of rows and columns. By applying CUR matrix decomposition, we can identify the significant rows and columns that represent the matrix well, allowing us to pinpoint characteristic sensors and time periods from massive data, which yields effective factor analysis for enhancing factory productivity.
In CUR matrix decomposition, a parameter matrix corresponding to each feature in matrix X is introduced to calculate the importance of each feature. Important features are extracted by setting features with negative importance to zero. In Fig. 2(b), the parameter matrix has four rows corresponding to each column’s features in matrix X in Fig. 2(a). In Fig. 2(b), the first and third rows of the parameter matrix are zero, indicating that the features of the first and third columns of matrix X in Fig. 2(a) are not important. In contrast, the features of the second and fourth columns are important. Although CUR matrix decomposition extracts important features from the parameter matrix, it requires iterative calculations, which are computationally expensive, making it difficult to apply it to large-scale data.
We proposed a method to rapidly execute CUR matrix decomposition by lightly calculating the upper and lower bounds of importance [1]. This method accelerates the iterative calculation of importance. As shown in Fig. 2(c), if the upper bound of importance is negative, the exact importance will also be negative, enabling us to skip the calculation of that feature. If the lower bound of importance is positive, the exact importance will also be positive, so we prioritize calculating that feature. By using the upper and lower bounds of importance, we can omit unnecessary calculations and focus on computing the features with non-zero importance, thus accelerating CUR matrix decomposition.

Fig. 2. Efficient CUR matrix decomposition.
3. Termination of computations that cannot yield solutions
Next, I introduce a method to accelerate processes by terminating computations that cannot yield solutions. This method maintains patterns that failed during the search process, terminating the process early when these patterns reappear. An example of this pruning method is the acceleration of subgraph search.
Subgraph search is a process of finding subgraphs with the same structure as the query graph within a large data graph in which the nodes are labeled. In Fig. 3(a), the query graph consists of two triangles with labels A, B, C, and C, D, A; the corresponding red subgraph in the data graph also consists of triangles with the same labels. An application of subgraph search is the search for organic compounds. The bond relationships between molecules of organic compounds can be represented as graphs, and compounds with common bond relationships are known to have similar properties. Using subgraph search to find organic compounds with the same bond relationships, compounds with properties similar to the query can be discovered. However, subgraph search requires mapping each node of the query graph to the data graph, leading to exponential time complexity concerning the size of the graph. Therefore, subgraph search incurs excessive processing time as the data graph becomes large.
We proposed a method to maintain the patterns of failed mappings and terminate the process early if these patterns reappear during the search process [2]. In Fig. 3(b) (upper), mapping node u0 with label A to v0, u1 with label B to v2, u2 with label C to v7, and u3 with label D to v10 causes node u4 with label A to be forced to map to v0, leading to a failure. Investigating this failure reveals that mapping u0 to v0 and u2 to v7 causes the issue. Specifically, if we map u2 of label C to v7, the connected node of label D of which is only v10, we must map u3 to v10, and since only v0 is the node of label A connecting to v7 and v10, we fail to find a subgraph if we already have mapped u0 to v0. Hence, the pattern of mapping u0 to v0 and u2 to v7 is stored as a termination condition. If this pattern reappears during the search, the process is terminated early. In Fig. 3(b) (lower), mapping u0 to v0, u1 to v3, and u2 to v7 matches the stored termination condition, so the process is terminated without further exploration. Thus, terminating computations that cannot yield solutions prunes unnecessary processes, enabling faster subgraph search.

Fig. 3. Efficient subgraph search.
4. Fast computations through optimistic processing
Finally, I introduce a method that prunes computations through optimistic processing. This method temporarily removes a constraint to find a solution quickly then verifies if the obtained solution meets the constraint, which enhances speed. An example of this pruning method is the fast computation of b-Matching graphs.
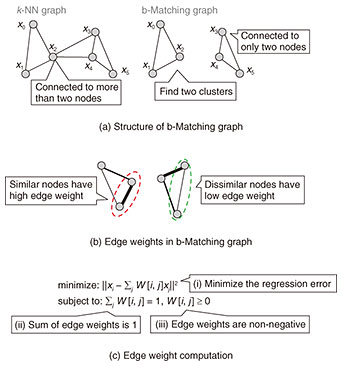
A b-Matching graph is a neighborhood graph in which each data point is connected to a specified number of neighbor data points. While k-nearest neighbor graphs are often used, where each data point is connected to k neighbor data points, they can result in data points having more than k connections. In Fig. 4(a) (left), each data point is connected to two neighbors in a k-nearest neighbor graph, but data points x2, x3, and x4 end up with more than two connections. In the b-Matching graph (Fig. 4(a), right), however, each data point has exactly two connections, capturing the cluster structure more effectively where no data point has excessive connections. Additionally, edge weights in a b-Matching graph are determined by data similarity. Specifically, in Fig. 4(b), edges between similar data points that are close together have larger weights, while edges between dissimilar data points that are far apart have smaller weights. This makes b-Matching graphs effective for capturing cluster structures, as similar data points within the same cluster are more likely to be connected. This property can be applied to tasks such as parking lot status estimation and credit card fraud detection by effectively estimating data labels from neighboring data points.
To compute a b-Matching graph, it needs to (1) find the specified number of neighbor data points for each data point and (2) compute the edge weights. The details of the finding neighbors are omitted here. For the edge weight computation, solving the optimization problem shown in Fig. 4(c) is required. In Fig. 4(c), xi represents the i-th data point, and W[i, j] represents the edge weight between the i-th and j-th data points. This optimization problem aims to minimize regression error, as shown in Fig. 4(c), while satisfying the constraints that the sum of edge weights equals one and edge weights are non-negative. Solving such constrained regression typically requires using an optimization solver, which incurs high computation costs, thus lengthening the time required to compute edge weights in b-Matching graphs.

Fig. 4. Efficient b-Matching graph.
We proposed a method for quickly computing edge weights in b-Matching graphs through optimistic processing, enabling faster b-Matching graph computations [3]. The method first minimizes the regression error to compute the edge weight by ensuring that the sum of the edge weights is 1 through regression analysis instead of an optimization solver. It then checks if the edge weights satisfy the constraint that the edge weights be non-negative. Since this method uses the solver only when the edge weights do not meet the temporarily removed constraint, we can reduce the number of times the solver is needed. Thus, optimistic processing enables rapid computations while maintaining the rigor of results by initially removing a constraint, quickly finding a solution, then ensuring the constraints are met.
5. Conclusion and future prospects
With the remarkable progress in database and Internet technologies, we can now collect and analyze digital data on an unprecedented scale. Thus, data are becoming an increasingly valuable resource and used across various fields to discover new insights and support decision-making. Our society is shifting toward leveraging this new resource, and this trend is expected to accelerate.
In response to this societal trend, our research team is working to develop a machine learning platform that provides fast and accurate data analysis. Specifically, we are focused on developing algorithms that can process vast amounts of data efficiently and accurately, as well as constructing efficient data management systems. Through these efforts, we aim to create an environment where more people can effectively leverage data.
In the future, we hope that our machine learning platform will be widely adopted as a fundamental part of social infrastructure and that innovative applications leveraging data analysis will emerge across various fields. To achieve this vision, we will continue to pursue cutting-edge technologies and maximize the potential of data analysis.
References
| [1] |
Y. Ida, S. Kanai, Y. Fujiwara, T. Iwata, K. Takeuchi, and H. Kashima, “Fast Deterministic CUR Matrix Decomposition with Accuracy Assurance,” Proc. of the 37th International Conference on Machine Learning (ICML 2020), pp. 4594–4603, Virtual event, July 2020. |
| [2] |
J. Arai, Y. Fujiwara, and M. Onizuka, “GuP: Fast Subgraph Matching by Guard-based Pruning,” Proc. ACM Manag. Data, Vol. 1, No. 2, Article no. 167, 2023.
https://doi.org/10.1145/3589312 |
| [3] |
Y. Fujiwara, A. Kumagai, S. Kanai, Y. Ida, and N. Ueda, “Efficient Algorithm for the b-Matching Graph,” Proc. of the 26th ACM SIGKDD International Conference on Knowledge Discovery & Data Mining (KDD 2020), pp. 187–197, Virtual event, July 2020.
https://doi.org/10.1145/3394486.3403061 |
 |
- Yasuhiro Fujiwara
- Distinguished Researcher, Recognition Research Group, Media Information Laboratory, NTT Communication Science Laboratories.
He received a B.E. and M.E. from Waseda University, Tokyo, in 2001 and 2003, and Ph.D. from the University of Tokyo in 2012. He joined NTT Cyber Solutions Laboratories in 2003 and is currently a researcher at NTT Communication Science Laboratories. His research interests include databases, data mining, artificial intelligence, and machine learning.
|


