 |
|||
|
|
|||
|
Letters Vol. 5, No. 7, pp. 17–21, July 2007. https://doi.org/10.53829/ntr200707le1 Management Method for Detecting Network Quality Degradation on a Per-user Basis and Per-service BasisAbstractThis paper describes a management method for detecting network quality degradation on a per-user basis and per-service basis. The key point is to measure such network quality at the entrance of a home network (network end) and detect quality degradation caused by network factors such as a lack of bandwidth and bottleneck of a low-speed interface. The functions for measuring quality are clarified and a management method for video distribution services is explained as an example.
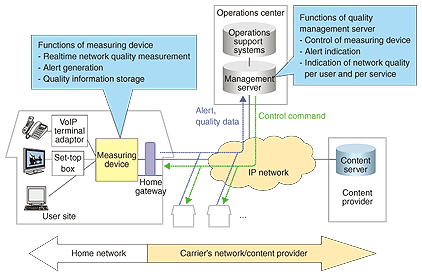
1. IntroductionVarious services such as video distribution and video communication as well as Internet connection and telephony are now provided in IP (Internet protocol) networks as a result of the progress of broadband networks. While IP telephony is a narrowband type of service, network usage increases dramatically when broadband services such as video distribution and video communication are provided. Quality degradation can occur because the traffic of such services sometimes becomes congested in the network. Fee-based video distribution services are beginning to be provided over IP networks, and the content delivery type of business is expected to grow in the near future. Moreover, it will be necessary to manage network quality taking into consideration high-quality video distribution services such as next-generation IPTV. That is to say, a method that can manage IP network quality, by detecting quality degradation and taking countermeasures quickly, is becoming required. At present, no efficient tools or methods exist for managing network quality continuously on a per-user or per-service basis. Therefore, a field worker must be dispatched to the user's site to determine the quality degradation between the user and network. That takes a lot of time and effort. To evaluate network quality caused by degradation factors efficiently and provide a high quality of service, we need a management method that can measure and analyze quality on a per-user or per-service basis. This article describes such a method. 2. Concept of management methodThis section describes the concept of our management method designed for video distribution services. In such services, it is absolutely necessary to clarify the cause of quality degradation quickly. The degradation is classified into three categories: trouble in the home network, a problem in the carrier's network, or a problem with the content provider's equipment. Measurement at the boundaries of these three categories is required to maintain end-to-end quality. We need to identify what kind of service, such as VoIP (voice over Internet protocol), video communication/distribution, or P2P (peer to peer), would be degraded. It is especially important to measure the quality perceived by each user in the case of video distribution services because different users have different subjective impressions of quality. Therefore, it is necessary to measure it at the entrance of the home network (called the "network end" hereafter), as shown in Fig. 1.
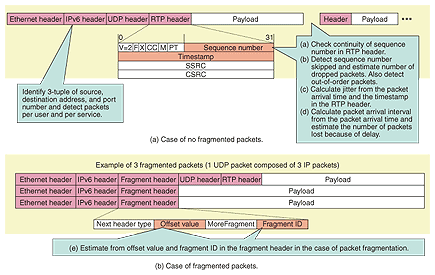
It is difficult to react quickly when a field worker must visit the user's site and measure quality at the network end. Furthermore, he or she requires a powerful measuring device to capture all the packets being sent and received at the network end. First, we try to clarify whether the quality degradation is occurring in the home or on the network/content provider side. Realtime management is impossible if all the captured packets are analyzed because the amount of data is too large. However, if we capture only packet header information and use that to calculate video quality, then realtime analysis is possible, as shown in Fig. 2. It is efficient to use the minimum necessary information, rather than using all the packet data.
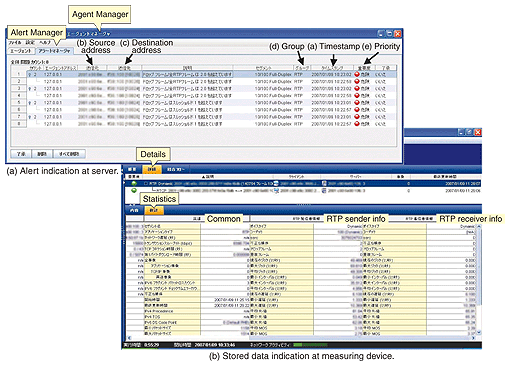
Since packets can be very long, they are sometimes split into smaller easier-to-handle fragments. Each fragment is given its own fragment header to identify it and its related packets. Our management method must be able to process both kinds of packets. It would be feasible for an operator to administer and control the measuring device at the network end remotely if the amount of information to be processed and stored could be reduced. Quality management at the network end based on analyzing statistical information is effective and will become important in the future. 3. Overview of functionsThe network quality management consists of the measuring device at the network end and a quality management server in the operations center, as shown in Fig. 1. 3.1 Measuring deviceIt is effective to install a measuring device at the user side after the home gateway because the degradation point is determined by whether the cause is in the home or on the network/content provider side as the first step. The measuring device passively acquires the packets sent and received by the user by means of the following functions. (1) Realtime quality measurement The measuring device detects the packets per user and per service by identifying the source address, destination address, and port number and analyzes the service quality. (2) Alert generation An alert generator sends an alert to the server if quality falls below a threshold set in advance. (3) Quality information storage A storage device automatically stores information required for quality analysis (source address, destination address, port number, etc.) at the meas–uring device at predetermined intervals. It also transfers the stored files to the server. The device stores approximately 1 Mbyte per day in the case of saving one-minute's worth of RTP (real-time transport protocol)* information. 3.2 Quality management serverThe quality management server has the following functions for controlling the remote measuring device. (1) Control of measurement device (on/off) The server can turn the measuring device on and off remotely. It can also set the interval for quality data storage and the threshold for alerts. (2) Alert indication An alert is shown when the quality index falls below a threshold set taking into consideration fragmented packets. The following information is sent from the measuring device to the server, as shown in Fig. 3.
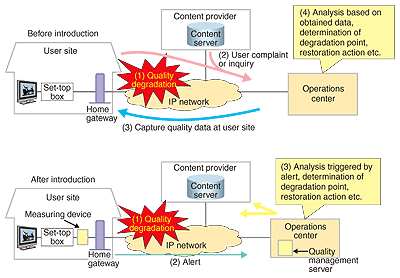
a) Timestamp: the time when degradation was detected b) Source address: IP address of the source of content affected by degradation c) Destination address: IP address of destination affected by degradation d) Group: type of application affected by degradation e) Priority: level above threshold (3) Network quality indication per user and per service This function gets data stored at the measuring device and indicates the network quality on a per-user basis and per-service basis from the source address, destination address, and port number. 4. Application to an actual networkWe are currently testing our management method in a realistic application. The measuring device is installed at the network end at the time of service setup, before a user makes a complaint. An operator sets the threshold for alerts, connects the measuring device to the server, and monitors service quality constantly. When an alert is sent to the server, the operator controls the measuring device from the server and collects stored quality data. He or she can easily and quickly take the next appropriate action such as sending a message to the content provider or determining the degradation point through a data analysis. An example of applying this method to an actual network service is shown in Fig. 4. The operator understands the quality degradation as soon as a user feels it, so quick and appropriate action is possible.
5. ConclusionWe described our method of detecting quality degradation on a per-user basis and per-service basis and the required functions. This method is expected to reduce the size of the quality measuring function and enable quick determination of the cause of degradation. Once such an environment has been set up, it will be necessary to collect quality data from a huge number of users and analyze an enormous amount of data. Therefore, efficient analysis methods for clarifying the affected area and estimating the point of failure are required. In future, we will study the application of this method to real operations. |
|||


