 |
|||
|
|
|||
|
Special Feature on Technical Solutions to Real-world Problems Vol. 5, No. 8, pp. 15–17, Aug. 2007. https://doi.org/10.53829/ntr200708sf4 Searching for Optical Failure LocationsAbstractThe rapid spread of broadband communication services has been accompanied by a rapid increase in the number of optical subscribers. However, this has also led to more failures related to optical services. This article explains the principle of the optical time domain reflectometer (OTDR), which is used mainly in the repair of optical fiber failures, and introduces some useful information about it.
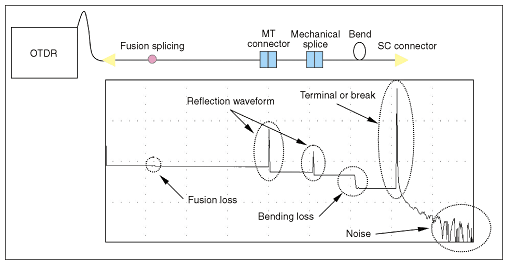
1. BackgroundWith the aim of reaching the goal of 30 million optical access lines by 2010, NTT has been increasing the number of optical communication facilities. Achieving a highly reliable optical communication network requires continual increases in the efficiency of maintaining, operating, and managing a huge amount of equipment. A system is required for rapidly identifying the location of a failure and restoring operations when a problem occurs in an optical communication network. Currently, when a failure occurs in an NTT East optical fiber cable, the optical time domain reflectometer (OTDR) is used to locate the failure. The appropriate repair is then made. When the OTDR is used properly, it provides information about the failure location, optical loss, and amount of reflection. This article describes the principle of this pulse tester and important points concerning measurements made using it. 2. Principle of the OTDRWhen an optical pulse is injected into an optical fiber, the OTDR extracts two kinds of light that return to the injection side: Rayleigh back-scattered light and Fresnel reflections. This information is used to determine the state of the optical fiber lines. Rayleigh back-scattered light and Fresnel reflections return with delay times proportional to the distance from the point of reflection. When the temporal change in optical power of the returning light is measured, a waveform such that as shown in Fig. 1 is obtained. From this waveform, it is possible to measure the optical loss and determine the locations of connection points as well as breaks in the optical fiber line.
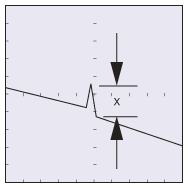
3. Important points concerning OTDR measurementThe waveform obtained with the OTDR varies with parameters such as the measurement wavelength and the pulse width, so it is important that these values are set properly when measurements are taken. This article focuses on the pulse width and explains some measurement issues concerned with it. 3.1 Relationship between pulse width and resolutionThe pulse width is the duration of light injection from the light source. A small pulse width results in a high resolution, but the optical power is too low to allow the measurement of distance. Conversely, a large pulse width is suitable for measuring distance, but the resolution is low. Accordingly, on-site selection of a pulse width suitable for the distance to be measured is required. 3.2 Relationship between pulse width and amount of reflectionIf the optical path contains a reflection point, the waveform measured by the OTDR is as shown in Fig. 2. The amount of reflection attenuation Y can be obtained from X in the figure, but the relationship between these two values varies with the pulse width. This variation is caused by the change in Rayleigh scattering level with pulse width.
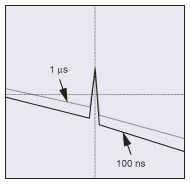
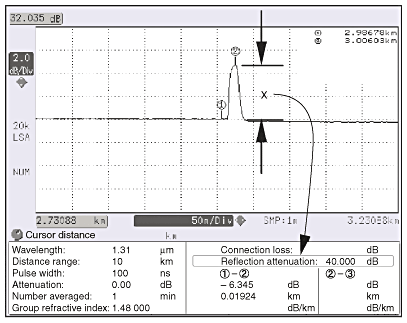
The change in the pulse waveform that accompanies a change in the pulse width is shown in Fig. 3. Changing the pulse width changes the value of X. The relationship between X and the amount of reflection attenuation Y is expressed by Y = −{10logR + 10log(10X/5−1)}, (1) where R is a variable determined by the currently set pulse width and other such factors; it is proportional to the pulse width. The results of using Eq. (1) to calculate the relationship between pulse width and X for the case where there is a connection with a reflection attenuation of Y=40 dB are listed in Table 1. The value of X varied greatly with the pulse width, even for a connection with 40-dB attenuation. The current pulse tester has a function for automatically calculating reflection attenuation by means of a marking operation, etc. (Fig. 4).
4. ConclusionWe have partially described how the OTDR is used in the process of maintaining optical fiber lines. The Technical Assistance and Support Center will continue efforts to provide support with technology obtained from the Maintenance Department. |
|||


