|
|||||||||||||||||||||||||||||
|
|
|||||||||||||||||||||||||||||
       |
Vol. 5, No. 11, pp. 11–16, Nov. 2007. https://doi.org/10.53829/ntr200711sf2 Detecting the Degree of Anomaly in Security VideosAbstractWe introduce a method of detecting video scenes that require attention and presenting them in order of significance. We use a statistical method to detect a pattern that differs from the regular pattern and extract the distance between them as an anomaly. If this method is applied to monitoring systems, it should greatly reduce the cost of checking a huge amount of video data. 
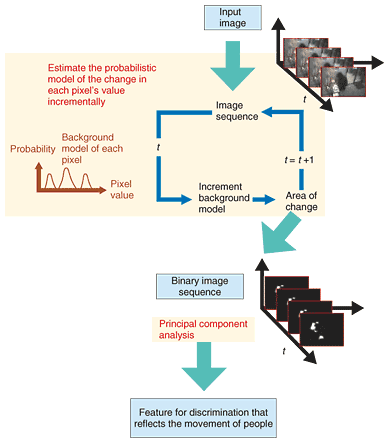
1. IntroductionWith the rapid increase in the number of video security systems, one new problem is how to manage the enormous amount of video data being captured and stored over networks. The cost of reviewing and checking security videos is extremely high, so an automatic surveillance method that can efficiently check videos is required in order to reduce the time and expense of manual confirmation. One idea is anomaly detection, that is, to discriminate video images from the viewpoint of whether or not they look like ordinary scenes [1]. After this discrimination, we can tag sequences as either normal or anomalous. Tagging reduces the volume of videos that must be reviewed. To discriminate the anomalous samples by training, one existing method finds anomalous sequences by using prior knowledge or by learning normal data [2]. If we define the steady state as some feature pattern, we can discriminate an anomalous feature pattern by comparing it against the steady-state feature pattern. However, in many cases of anomaly detection, we do not know in advance what might be anomalous. Accordingly, we decided to take the nonsupervised approach. 2. Our approach2.1 Features for anomaly detectionFeatures based on areas of movement are effective for detecting anomalies because the presence or absence of moving objects is important information. One major feature extraction method for detecting anomalies is extracting the tracks of moving objects [3]–[5], which is effective when the tracks are labeled as normal or anomalous. Another method uses a local spatio-temporal feature that can discriminate anomalous scenes based on the types of action [6]. In our research, we use a spatio-temporal feature that can extract information from sufficiently long periods to discriminate anomalous scenes based on a sequence of human movement. First, we extract the areas containing movement in each frame. Our approach is to estimate the distribution of image pixel values as a probabilistic model [7] and then subtract the estimated background. We then obtain a binary image sequence in which each frame has a foreground value of 1 and background value of 0. The sequence is divided into sets of a constant number of frames to yield the feature sets. One problem is that the dimensionality of the feature is too high to allow the feature to be input directly into the statistical discrimination module. Our solution is reduce the dimensionality of the feature by principal component analysis (PCA). We use the dimensionally reduced feature by taking a small number of principal components—those whose contribution rates are adequate. We examine the first n principal components (ranked in order of decreasing eigenvalue), where n is defined as the number that makes the ratio of the sum of the first 1-n eigenvalues divided by the sum of all eigenvalues of the variance-covariance matrix equal to 0.9. After obtaining the binary image sequence, we consider each image as a one-dimensional vector whose size is x × y = X. To make the following discrimination process efficient, we reduce the size of X by applying PCA to the sequence I' (x, y, t). We use the first pth component and obtain the principal component feature sequence F(t) (t=1, 2, …). After obtaining F(t), we cut it into small sequences. We then create a set of matrices whose dimension is p × N, where p is the size of the dimensionally reduced feature of the image and N is the length of each small sequence cut from the whole sequence. We determine the matrix whose components are F(t-N), F(t-(N-1)), …, F(t) as the feature. The algorithm is shown in Fig. 1.
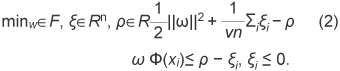
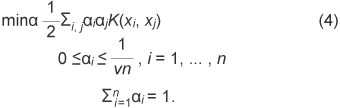
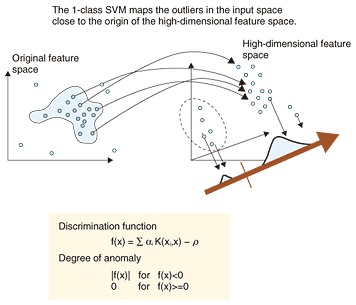
This feature enables even very small movements to be robustly obtained and can reflect timing information about movements. For example, when the movement of a person traces a different track from those of other persons, the area of the silhouette in the spatio-temporal space is different from those of others and a different feature is obtained. This suggests that suspicious movements can be detected. Figure 1 also shows the process for obtaining the spatio-temporal feature for discriminating anomalous movements. After the binary images have been extracted by subtracting the background, whose model is estimated incrementally, the images are dimensionally reduced by PCA. The sequences of principal components are used as the feature for discrimination. 2.2 Detecting the degree of anomaly using a 1-class SVMOutliers in feature space are treated as anomalous samples. There are several algorithms that can detect outliers in sample distributions. One defines a sample as an outlier if it is not contained within any pre-learned classes [2]; others are based on clustering [3]–[5], based on estimating a probability function or using the subspace method [6]. In our approach, we use a 1-class support vector machine (SVM) [8], which is a nonsupervised outlier detection method. By optimizing the nonlinear evaluation function, it determines the axis on which some samples are discriminated as outliers. On this axis, the degree of anomaly can be quantitatively extracted as the distance from the outlier to the major distribution containing most of the samples. The 1-class SVM maps the outliers in the input space close to the origin of the high-dimensional feature space when using a Gaussian kernel We use Eq. 1 as the discrimination function. To solve Eq. 2, the super plane discriminates the sample sets such that the rate ν of all sample sets lies below the origin. Here, ν is set in advance.
Equations (1) and (2) are extended by using the kernel trick for the nonlinear case to yield Eqs. (3) and (4).
A discrimination axis that maximizes the distance of all samples from the origin is determined by the 1-class SVM by optimizing Eq. (4). The samples with constant rate ν, which is set in advance, become outliers. In the feature space, as the distances between sample x and all other samples increase, the value ΣiαiK(xi, x) − ρ in function f(x) in Eq. (3) becomes smaller. Sample x is considered anomalous if the value of ΣiαiK(xi, x) − ρ is negative, and in that case, we use the scalar of |ΣiαiK(xi, x) − ρ|(= |f(x)|) as the degree of anomaly. As |f(x)| increases, sample x is considered to become more anomalous. Since the mapping process is nonlinear, the size of f(x) does not directly represent the distance between samples in the original feature space. Scholkopf et al. presented experiments on two-dimensional feature data. They found that the discriminant boundary changed from the center of the distribution to outside, like a contour line, when ν was increased [8]. Our preliminary experiment using a small two-dimensional data set showed that there is an order relation between the size of ν and the degree of separation between the origin and x. The constant value σ must be set appropriately. The value of ν indicates what percentage of all samples are outliers. The user sets ν according to the amount of video data that the reviewer wants to examine. The discrimination process using the 1-class SVM is shown in Fig. 2.
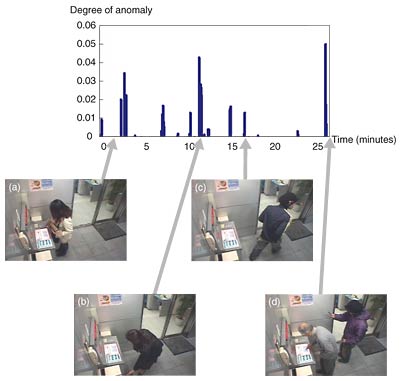
This algorithm is assumed to be valid when the majority of the samples are composed of sequences of the regular state. For this reason, this discrimination is applicable to monitoring videos in which there is a state that is considered regular. Such environments include the exits/entrances of offices and bank ATM (automated teller machine) areas, where only a small number of people occupy the field of view, one at a time, and the tracks of the people are generally fixed. 3. Experiment3.1 Data and conditionsTo estimate the performance of our method, we conducted an experiment using a security video captured by reproducing a typical setup of a bank ATM. A CCD (charge-coupled device) camera was set about 2 m above the floor and angled to observe people using the ATM. To assess our method, we labeled all the video sequences as either normal or anomalous. These cuts, 40 normal sequences and 10 anomalous sequences, were recorded separately and then merged to yield a 30-minute video. Normal cuts contained sequences in which people stepped up to the cash dispenser, withdrew or deposited money, and then moved away. The cuts containing anomalous sequences showed scenes such as someone removing transaction receipts from the wastebasket. The video was recorded on digital video tape at the rate of 30 frames per second. After compositing, each frame was converted into a JPEG image of 160 × 120 pixels. The number of dimensions was reduced to 20 by taking the first 20 principal components of PCA. The spatio-temporal feature, 20 × 500 (frames), was extracted starting from every 15th frame; 3600 input features were obtained from the 54,000 frames of the 30-minute video. The number of input features that contained anomalous sequences was 150. Those features were labeled as anomalous. In SVM processing, we set ν to yield the desired volume of anomalous cuts. The parameters were set to ν = 0.05 and σ = 0.01. To decide σ, we conducted an experiment using small subsets of various σ values, with ν held constant and selected the value that yielded the best performance. 3.2 Experimental resultsA graph of the change in degree of anomaly extracted by the 1-class SVM is shown in Fig. 3. Any input feature that yielded a negative f(x) value was treated as anomalous. The system assigned negative f(x) values to 124 features, 98 of which were among the 150 features manually labeled as anomalous. As a result, 8 sequences out of the 10 anomalous sequences were detected. Examples of frames from the sequences discriminated as anomalous and normal are also shown in Fig. 3. Sequence (a) manually tagged as normal and sequences (b)–(d) manually tagged as anomalous were extracted. The results show that the movements considered normal and anomalous were well discriminated by our method. In sequence (b), a woman was picking her luggage up from the floor. This was tagged as normal but extracted as anomalous. This is understandable because other people did not perform this action, so it was definitely irregular.
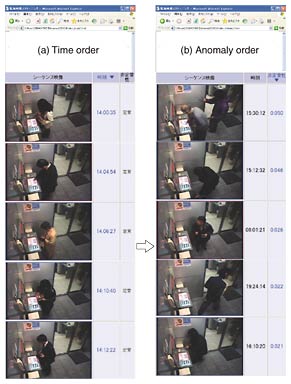
A screenshot of a function for sorting the time-order sequences by anomaly order is shown in Fig. 4. This helps people to check videos.
4. ConclusionWe are developing a method that can identify anomalous sequences in security videos. One of its characteristics is that it uses a spatio-temporal feature; no heuristics are used. Another is that it is based on nonsupervised learning using a 1-class SVM, so it does not need prior labeling of data. We use the discrimination function of the 1-class SVM to identify anomalies. Our method was applied to a staged video showing a bank ATM. The video contained a mixture of known normal/anomalous cuts, and the change in the degree of anomaly over time was calculated. The results show that the sequences discriminated as anomalous with high degrees of anomaly contained cuts labeled as anomalous. These results indicate that the degree of anomaly derived by our method closely matches human intuition. Future work includes conducting more extensive trials to discover the limits of this method. We intend to improve the algorithm so that training is performed incrementally because the cost of retraining the system by adding new samples to the original data set is too high. References
|
||||||||||||||||||||||||||||