|
|||||||||||||||||||||||||||||||||||||
|
|
|||||||||||||||||||||||||||||||||||||
       |
Letters Vol. 6, No. 2, pp. 43–51, Feb. 2008. https://doi.org/10.53829/ntr200802le1 Novel Ray-tracing Acceleration Technique Using Genetic Algorithm for Radio Propagation PredictionAbstractThis article describes a ray-tracing acceleration technique that uses a genetic algorithm (GA_RT method) to mitigate the problem of performing large-scale computation for predicting mobile radio propagation in a practical amount of time. Computer simulation results for its performance show that the number of calculations is reduced to approximately 20% when the allowable calculation error is 4 dB. Moreover, when there are many calculation points in a wide area, a chain model is used in conjunction with the GA_RT method. This combination minimizes the computation time to approximately 6% with a calculation error of approximately 1 dB. 
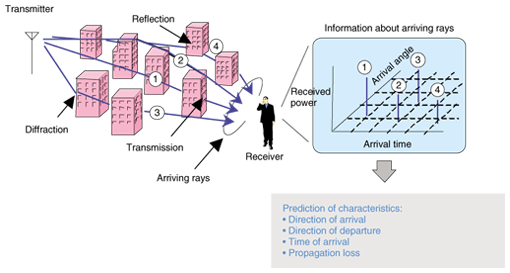
1. IntroductionIn mobile communications systems, it is extremely important to predict radio propagation characteristics, especially the propagation loss, when designing service areas. The Okumura-Hata model is usually used to estimate the propagation loss when the antenna of the base-station is mounted higher than the surrounding buildings [1]. This model is very easy to use because it is expressed as a propagation loss prediction formula that only uses four parameters: the two-dimensional distance in the horizontal plane between the base station and a mobile station, the frequency, and the heights of the base- and mobile-station antennas. The values of these parameters are easily obtained. However, the Okumura-Hata model was derived experimentally by statistically analyzing measurement data, so it can be applied only within the following limits: transmitter-to-receiver distance from 1 to 20 km, frequency from 150 to 1500 MHz, base-station antenna height from 30 to 200 m, and mobile-station height from 1 to 10 m. In recent years, with progress in mobile communication systems, base-station antennas have frequently been mounted below the surrounding rooftops and a cell size smaller than 1 km has been used in urban areas. In these situations, the Okumura-Hata model cannot be applied and a model that can predict more site-specific characteristics is desired. FuΡth ermore, the prediction of other characteristics such as the direction of arrival, direction of departure, and time of arrival has recently become important in order to estimate the performance of spatial-temporal signal processing techniques in practical communication environments [2], [3]. The ray-tracing method has been used effectively for rendering in the field of 3D computer graphics [4]. In the radio propagation prediction field, many years of study have gone into creating practical methods based on ray-tracing for site-specific prediction [1]. An overview of the ray-tracing method for radio propagation prediction is shown in Fig. 1. Rays are geometrically traced from the transmitter to the receiver while taking into consideration the interaction with structures (reflection, diffraction, or transmission). Propagation characteristics are predicted based on information about the rays such as the electric field, path length, arrival angle, and departure angle. Here, there is a trade-off relationship between the prediction accuracy and computation time. To obtain a high level of prediction accuracy, it is necessary to trace the higher-order rays that undergo many interactions, while taking into account as many structures as possible in as wide an area as possible. This increases the number of ray-tracing processes and computation time. Acceleration of the ray-tracing process has become a major issue. In this article, we introduce two ray-tracing acceleration techniques: the GA_RT method and a chain model [5]. The GA_RT method effectively applies a genetic algorithm [6] to the ray-tracing process and the chain model performs the GA_RT method efficiently when there are many calculation points arranged on a surface, i.e., area prediction. The performance of these acceleration techniques was evaluated by computer simulation.
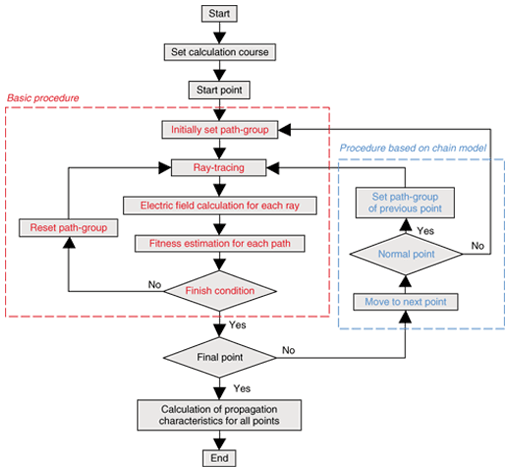
2. Ray-tracing acceleration techniques2.1 Approach to accelerationIn general, there are three approaches for accelerating the ray-tracing process: 1) optimizing the ray-tracing process, 2) improving the efficiency of the ray-tracing algorithm, and 3) distributing the ray-tracing computational load. In the first approach, the types of rays are limited based on an empirical/theoretical propagation path model for reducing the number of traced rays. This approach has the potential to reduce the number of computations dramatically even though the prediction accuracy is degraded. The vertical plane launching (VPL) method reported in [7], [8] and our sighted-objects-based ray-tracing method (SORT method) [9] are examples of this approach. In the second approach, the efficiency level of the ray-tracing algorithm, such as the imaging method and ray-launching method, is improved. Basically, in this approach, the computations are not approximated, so the prediction accuracy is not degraded. However, pre-processing before ray-tracing is generally required. The imaging method using a visibility graph [10] and the ray-launching method using a triangular grid [11] are examples of this approach. In the final approach, ray-tracing calculations are distributed to several other machines connected over a network. In this approach, there is no degradation in the prediction accuracy. Moreover, as long as it is used in a range where the network transfer rate does not become a bottleneck, the total processing speed will be proportional to the number of machines or central processing units used. If we can provide a suitable computing environment, this approach will be the most reliable. The most effective approach with a low cost is the first approach if a suitable propagation path model with a high level of prediction accuracy is available. However, it is generally very difficult to perform propagation path modeling that can be applied to any communication environment. Here, the VPL and SORT methods mentioned above have been proposed for an outdoor macrocell environment. If the problem is considered from another viewpoint, then a very effective acceleration method can be found for the ray-tracing processing by enabling the propagation path model to self-assemble adaptively for the surrounding communication environment. We focused on the genetic algorithm as a way to obtain the propagation path model by self-assembly. 2.2 Our techniqueA. Basic model Our GA_RT method is based on the imaging method as the ray-tracing algorithm, even though it is possible to apply the genetic algorithm to the ray-launching method. The procedure for ray-tracing in the imaging method is described below.
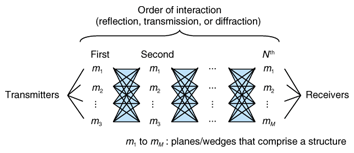
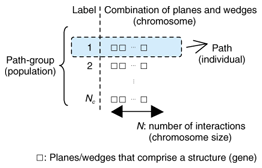
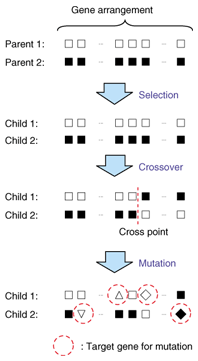
When the number of components is M and the number of interactions for the target ray is N, the number of combinations or ray-paths is expressed as Nall (= MN). Therefore, the computation time increases nonlinearly with the number of structures for N>1. On the other hand, many paths are rejected in general in Step 3 because interaction points cannot be defined based on the components. However, such eventually rejected paths cannot be known in advance. This means that the level of computation efficiency of the imaging method is low. In our GA_RT method, the number of ray-paths is limited appropriately by using the genetic algorithm in advance, so the efficiency level is higher. In a genetic algorithm, a chromosome is defined as a combination of multiple genes, whose corresponding characteristics are different from each other, and an individual is expressed by a chromosome. On the other hand, in the imaging method, ray-paths are expressed as combinations of components. This suggests that a genetic algorithm has a high affinity to the imaging method when each ray-path is handled as an individual. A population model defined using the GA_RT method is shown in Fig. 3. A component, a combination of components, and a ray-path are considered as a gene, chromosome, and individual, respectively. Note that the maximum value of the population size, Nc, is Nall. In addition, the fitness of each individual is defined as the received power of a ray traced along the corresponding path. The processing procedure in the GA_RT method is described below.
Here, in Steps 1 and 1', the path-group must be established (or re-established) using the following rules.
In this article, the calculation rate ρ is defined as an indicator to estimate the finish condition. It is given by where N(i)cal is the number of ray-paths that appear in the ith generation (or iteration process), but the paths that have already appeared in previous generations are not counted. Ray-tracing is finished when the value of ρ exceeds threshold value Ρth (0 ≤ Ρth ≤ 1), which is determined before processing. This means that ray-tracing processing in the case of Ρth = 1 is equal to the conventional imaging method, and the computation efficiency is evaluated Ρth times in the case of Ρth < 1 in this article even though the amount of time for the re-establishing process that is performed based on the genetic algorithm must be considered, strictly speaking.
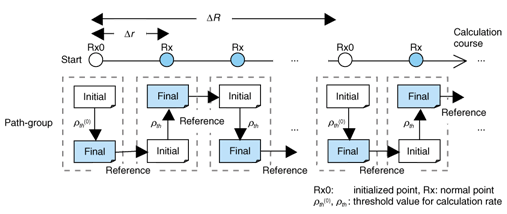
B. Chain model Our chain model is for performing the GA_RT method efficiently when there are many calculation points arranged on a surface, i.e., area prediction. The performance of the genetic algorithm depends on the initial population. When the initial population is suitable, the optimal results can be obtained in a short time. However, it is generally difficult to know such a population in advance. Now, let us consider the case of performing ray-tracing with the conventional imaging method for two calculation points A and B. The finally obtained ray-paths for A and B are different from each other when the location of A is far from that for B. However, as the locations approach each other, the difference becomes smaller. This means that when the calculation for A is finished, the finally obtained ray-paths for A are suitable as the initial path-group for B. Our model is named for this chain of events, which is shown in Fig. 5.
In the chain model, the calculation order is first established so that the distance Δr between calculation points is as short as possible. This process is called course setting. Next, the following two kinds of calculation points are defined. Here, Rx means a receiver.
Here, ΔR (≥ Δr), as shown in Fig. 5, is the distance between the initial points. As special cases, all calculation points become initial points for ΔR = Δr and become normal points for ΔR = ∞, except for the start point. Terms Ρth (0) and Ρth are threshold values for the calculation rate, which is established at Rx0 and Rx, respectively. The processing flow of the GA_RT method using the chain model is shown in Fig. 6.
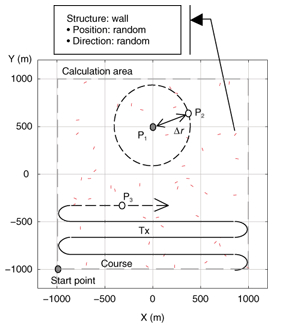
3. Performance evaluation3.1 Numerical simulationWe performed a numerical simulation to evaluate the performance of the GA_RT method. The calculation model is shown in Fig. 7. This is a two-dimensional model in the horizontal plane, in which walls having two vertical edges are randomly distributed in a 2 km × 2 km area. In this model, the location of the transmitter is (0, –500) and three types of calculation points are defined.
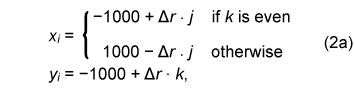
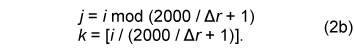
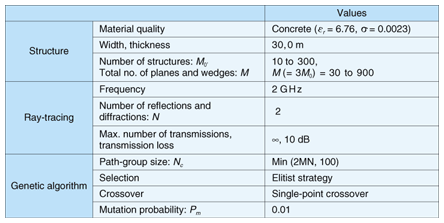
Here, on the meandering course, the position of calculation point P3 is expressed as where In Eq. (2b), [χ] is a Gauss symbol, where the value is the maximum integer that does not exceed χ. The calculation conditions are given in Table 1.
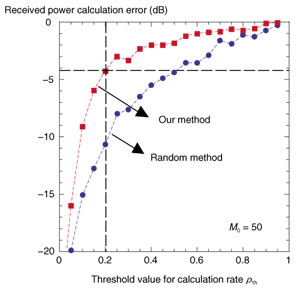
3.2 Simulation resultsFirst, the basic performance of the GA_RT method is shown. The calculated point was P1 in Fig. 7. In this evaluation, the chain model was not applied. The relationship between the threshold value of the calculation rate Ρth and the calculation error when the number of structures M0 was 50 is shown in Fig. 8. Note that the calculation error was averaged over 100 trials, in which the position and direction of each wall were changed. In Fig. 8, the calculated results obtained using a random method are also shown for reference. In the random method, the ray-paths, which in practice are traced, are extracted randomly from among the theoretically possible ray-paths. The number of paths was Ρth × Nall. The results in Fig. 8 indicate that the GA_RT method is improved by the application of a genetic algorithm because the absolute calculation error in the GA_RT method is always smaller than that in the random method. FuΡth ermore, it is apparent that the number of calculations can be reduced to approximately 20% if the allowable calculation error is within 4 dB.
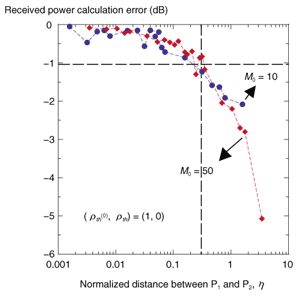
Next, the effect of the chain model is described. The relationship between the distance normalized by the average interval of structure position η and the calculation error is shown in Fig. 9 with M0 as a parameter. Here, the calculated points are P1 (as a normal point) and P2 (as an initial point) shown in Fig. 7, with (Ρth (0), Ρth ) = (1, 0). Normalized distance η is defined by where A is an area containing a distribution of walls with a size of 4 km2 (= 2 km × 2 km). In Fig. 9, the absolute calculation error becomes smaller as the distance between P1 and P2 becomes shorter, as mentioned in Section 2.2. Thus, our chain model is effective when distance Δr is set to a comparatively short value.
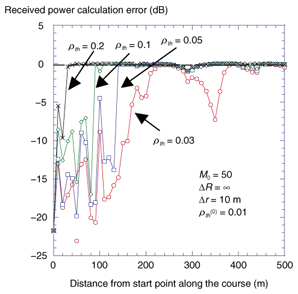
At the end of this section, we present results for area prediction. The calculated points were set on the meandering course shown in Fig. 8 and distance Δr was set to 10 m. Thus, the number of calculation points was 40,401 from Eq. 2, with the start point being (–1000, –1000) and the end point being (1000, 1000). FuΡth ermore, all points except for the start point were normal points because ΔR = ∞. The calculation error characteristics along the course are shown in Fig. 10 with the threshold value of the normal point calculation rate Ρth as a parameter. At the start point, the calculation rate was intentionally set to a low value, Ρth(0) = 0.01, so the calculation accuracy was poor. Note that the calculation accuracy improved step-by-step along the course and was maintained after sufficient improvement had been achieved, even when the calculation rate Ρth was a low value such as 0.03. The performance, such as the amount of improvement in each step, depended on calculation rate Ρth .
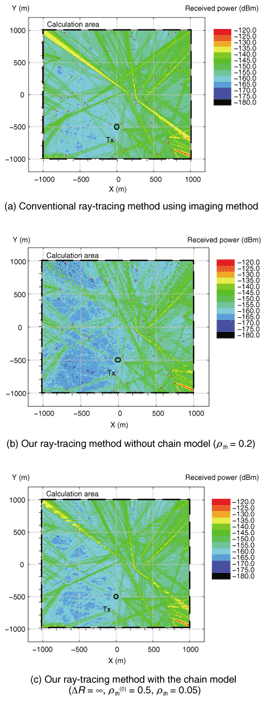
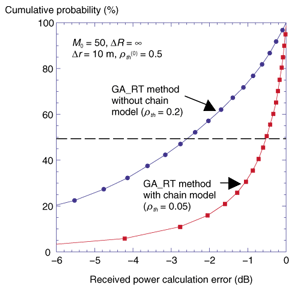
The results in Figs. 9 and 10 indicate that it should be possible to minimize the computation time if the calculation rate Ρth(0) is set to a value sufficient to give a high calculation accuracy level at the start/initial point. The calculated received power distributions of the conventional imaging method (which is defined as the true result in this article), the GA_RT method without the chain model (Ρth = 0.2), and the GA_RT method with the chain model (Ρth(0) = 0.5,Ρth = 0.05) are shown in Figs. 11(a), (b), and (c), respectively. These results clearly show that the GA_RT method with the chain model is very effective for area prediction. The cumulative probability of the calculation error calculated from the results in Fig. 11 is shown in Fig. 12. The computation time was minimized to approximately 6% with a cumulative 50% value of an absolute error of less than 1 dB (mean value: approximately 1 dB).
4. ConclusionIn this article we presented our GA_RT method with a chain model. The GA_RT method effectively applies a genetic algorithm to ray-tracing processing based on the imaging method, and the chain model supports the GA_RT method efficiently when there are many calculation points arranged on a surface, i.e., area prediction. The effectiveness of the method was simulated numerically, and the results showed that a reduction in the computation time by a factor of approximately 17 times can achieved if an error rate of approximately 1 dB is acceptable. Note that this was evaluated based on a comparison with the conventional imaging method. The GA_RT method can also be used in combination with other optimization methods. We have already completed an implementation of a previously developed practical propagation prediction system called the Urban Macro Cell Area Prediction System (UMAP) [9]. The next task is to perform a parameter study to make the GA_RT method work effectively with UMAP and verify the prediction results of the UMAP-GA_RT combination through comparison with measured results. References
|
||||||||||||||||||||||||||||||||||||