|
|||||||||||||||||||
|
|
|||||||||||||||||||
       |
Special Feature: NTT Technologies for the Environment and a Safe and Secure Society Vol. 6, No. 2, pp. 17–21, Feb. 2008. https://doi.org/10.53829/ntr200802sf3 Measurements of Photochemical Oxidant Using a Color Sensor NetworkAbstractWe are researching and developing a color sensor network that actively exploits color-change sensors that we have already developed. This article overviews a color sensor network for detecting ambient ozone, which is regarded as the main constituent of photochemical oxidants, and presents the results of outdoor experiments. 
1. Color sensor networkSensors are considered to be key constituent elements in a ubiquitous sensing network. Their size and interface are both important factors, especially when the sensors are incorporated into a network. The latest sensing networks mainly use physical sensors, such as temperature or acceleration sensors, and there are few studies on sensing networks that include other types of environmental sensors. One of the main reasons for this tendency is a lack of miniature sensors with sufficient sensitivity. Incidentally, in the field of gas sensors, there have been many studies dealing with methods of detecting target gases by utilizing color changes in the visible region. While gas detection tubes [1] are the most familiar products based on this technology, NTT Energy and Environment Systems Laboratories has been developing highly sensitive sensor elements for detecting ambient air pollutants such as ozone [2], nitrogen dioxide [3], and formaldehyde [4]. They change color when exposed to the airborne pollutants. Although these sensors enable us to perform a visual check easily, it is difficult to check hourly changes in pollutant concentration or compare differences in concentration between different measurement points. One of the advantages of a general sensing network is that it can monitor concentrations at multiple locations at the same time, and a two-dimensional distribution map can be made by processing the measurement data. In a color sensor network, color changes must be converted to numerical values to make the two-dimensional distribution map. For the numerical conversion, an optical method is usually used; for example, the reflected light intensity is measured using a device with a small light source and photodetector, and the light intensity is converted into a value of pollutant concentration. However, without optical measurement, we can do a numerical conversion by capturing images and processing them when we use a sensor element that changes color. A color sensor network is a sensing network based on the idea of gathering information such as an air pollutant's concentration distribution and hourly changes in concentration by using such a sensor element that changes color in the visible region, capturing an image of the sensor element, and converting this image data into information such as the concentration or strength of the sensed substance. The concept of the color sensor network is shown in Fig. 1. We place sensor elements that change color in the visible region at various points, capture images using an image capture device at various time intervals, and transfer the image data to image processing equipment. The image data is processed and converted into physical quantities that describe the target substance in the image processing equipment. We can make a map of an air pollutant's concentration distribution or analyze hourly changes in its concentration using the measured data together with geographic and temporal information. Moreover, we can use measured data as input data for several simulation programs. The color sensor network has three advantages: (1) The sensor can be compact because the measurement part is not included in the sensor device, (2) there is no need for power supplies other than those for the image processing and capturing equipment, and (3) sensors can be easily installed without interface problems. On the other hand, it is difficult to find a sensor element with high accuracy and sensitivity for the target substance, the brightness and hue of images varies considerably, and there are many kinds of image capturing device. At NTT Energy and Environment Systems Laboratories, we developed a highly sensitive and accurate ozone detection paper [5]. Therefore, we performed fundamental experiments on implementing a color sensor network using it.
2. Why ozone?Photochemical oxidants are atmospheric pollutants for which environmental standards have been set. Ozone is the main component among them (approximately 90%). It is ranked as an atmospheric pollutant requiring special caution not just in Japan but around the world. From the end of April 2007, a high concentration of photochemical oxidants that normally occur in the summer was observed around western Japan. News reports of related incidents such as canceled athletics events brought this anomaly to the attention of the general public. Ozone is harmful to plants as well as humans, and it is feared that rising ozone concentrations may lead to the depletion of forests and reduced agricultural yields. 2.1 Ozone detection paperSince our ozone detection paper is highly sensitive, the concentration of ozone in the ambient air can be estimated from the degree of fading, as shown in Fig. 2. Before exposure, the ozone detection paper is a deep blue color. After exposure, the blue color fades. We found a linear relationship between the color strength and the cumulative amount of ozone exposure. When the cumulative ozone exposure exceeds a fixed amount, the ozone detection paper becomes white and the blue color is completely lost. The cumulative amount of ozone that turns the paper white depends on the paper's sensitivity, We use a highly sensitive paper that turns white when exposed to 100 (parts per billion (ppb) × hours) for the experiments. In Japan, a photochemical oxidant warning is issued when the outdoor ozone concentration exceeds 120 ppb. Last summer, the maximum measured ozone concentration in Atsugi was over 160 ppb. Under these conditions, the ozone detection paper used in this study became completely white after less than one hour of exposure when it was hung in the air with both sides exposed.
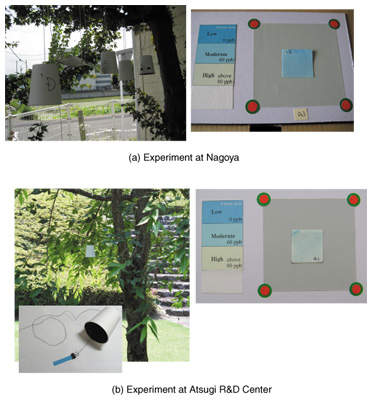
2.2 Measurement of outdoor ozone concentrations in Nagoya and AtsugiThe concentration of photochemical oxidants has recently been increasing year on year, and regional authorities have been issuing photochemical oxidant warnings for the first time in over a decade. This has resulted in various needs such as a need for some way of visualizing photochemical oxidants to raise public awareness and a need to compare concentrations measured at various different points. At NTT Energy and Environment Systems Laboratories, we have performed fundamental experiments on a color sensor network in cooperation with an organization that has such needs (Nagoya City Environmental Office). These experiments involved a procedure whereby highly sensitive ozone detection paper was exposed to the ambient air outdoors, images of the paper before and after exposure were captured, and image processing was performed to numerically convert the image data into ozone concentrations. To investigate the validity of these converted values, we also compared the ozone concentration measured close to our measurements points with the numerical values obtained after conversion. At the same time, a similar experiment was done at the NTT Atsugi R&D Center. Some photographs taken during actual outdoor measurements are shown in Fig. 3 together with the appearance of ozone detection papers after it was left outdoors for 1 hour between 11 and 12 am on June 20, 2007. The ozone concentration during this period was about 30 ppb at a point close to the measurement point in Nagoya and about 60 ppb at a point close to the Atsugi R&D Center. These concentrations were reflected in the exposure results. The Nagoya detection paper turned pale blue and the Atsugi one faded considerably to a bluish white. Since the detection paper used in this experiment was highly sensitive, a color change could be seen even for relatively low ozone concentrations of 30–60 ppb, making it suitable for use in applications such as raising public awareness. We replaced the ozone detection paper at hourly intervals and captured images of each paper. The relationship between ozone concentration obtained by the analytical instrument and that obtained by the conversion of image data into concentration values is shown in Fig. 4. The good correlation between them shows that the converted values are valid. We also confirmed that even when the ozone detection paper was not replaced every hour, a paper with lower sensitivity could enable differences to be calculated by using automatic image gathering equipment such as webcams at arbitrary intervals to obtain time-series data of ozone concentrations.
3. Future prospectsAlthough this article mainly focused on ozone detection paper, we are also researching and developing various other color sensors. It should be possible to construct sensing networks that can easily obtain several different types of information, using such color sensors together with image analysis techniques. In the future, we plan to continue our investigations aimed for color sensor networks. References
|
||||||||||||||||||