 |
|||||||
|
|
|||||||
|
Letters Vol. 7, No. 8, pp. 46–50, Aug. 2009. https://doi.org/10.53829/ntr200908le2 Traffic Monitoring System for Fiber-to-the-home Engineering WorkAbstractWe describe a traffic monitoring system designed to improve fiber-to-the-home (FTTH) engineering work by enabling technicians in central offices to observe, in real time, the usage state of FTTH services for each customer in detail when they perform operations such as changing cable routes. This will reduce service interruptions.
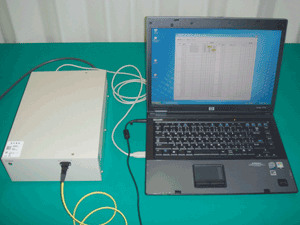
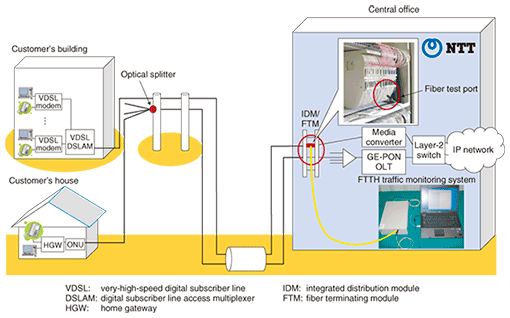
1. IntroductionFiber-to-the-home (FTTH) services, such as B FLET’S and FLET’S HIKARI NEXT, have been widely deployed in Japan, and the number of the customers exceeded ten million last year. As a result, the amount of central office work, such as cable route changes and optical fiber re-cabling construction, has increased. This has increased the likelihood of service interruptions because it takes a lot of time to check the statuses of the services of each customer individually upon completion of the work. In this article, we introduce a traffic monitoring system for FTTH engineering work [1] that can observe the state of current FTTH services (e.g., Internet access and IP (Internet protocol) telephony). The system can monitor the traffic on both the GE-PON (Gigabit Ethernet passive optical network) [2] and point-to-point media-convertor network sections. This system enables technicians to observe the exact state of current services in real time and thus discover mistakes in the cabling work without interrupting services in use. 2. Traffic monitoring system: configuration and functionsFor FTTH access services, optical network units (ONUs) are installed in customer premises and optical line terminals (OLTs) are installed in the central office. The monitoring system is connected to the fiber section between ONUs and an OLT, and it receives the upstream optical signal from the ONUs to the OLT. It identifies the state of services for each customer. It does not monitor the downstream signals because, in the GE-PON network, they are encrypted. The prototype of the monitoring system is shown in Fig. 1 and the configuration for monitoring upstream traffic is shown in Fig. 2. The monitoring system consists of an optical signal processing unit and a personal computer (PC). The system is connected to the fiber test port, which is used for testing with an optical time domain reflectometer installed in the integrated distribution module or the fiber terminating module in the central office. The system receives four or eight upstream optical signals from the ribbon fiber cable through the optical coupler unit. The monitoring system observes the link status between the OLT and each ONU, and it monitors the services being used by each ONU. Details of the monitoring method are described below for GE-PON as an example.
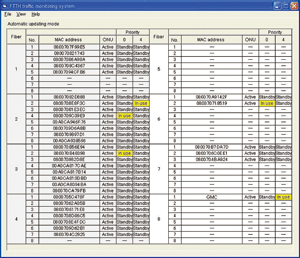
2.1 Link status monitoringThe monitoring system detects the GE-PON control frames (MPCPDU: multipoint control protocol data unit) and the data frames sent from each ONU. GE-PON uses the logical link identifier (LLID) in the preamble section of each Ethernet frame to segregate ONU traffic. Each ONU is assigned a unique LLID value by the OLT. The monitoring system counts the received MPCPDUs of each LLID (ONU) and then judges the link status between the OLT and each ONU by using the following algorithm. if {(LLID counter number >= threshold value) The system retrieves the media access control (MAC) address and the LLID of each ONU from the received MPCPDU and builds a MAC-address-to-LLID mapping table. This table enables ONU links to be shown together with the ONU’s MAC address on the display because the LLID is not a system-wide unique ID, but rather a virtual ID for the GE-PON section. 2.2 Service status monitoringThe monitoring system retrieves the LLID and the IEEE802.1D priority bits, which are located in the Ethernet frame header, from the received user data frames. The priority bits correspond to the service classes (e.g., best-effort Internet access and guaranteed IP telephony). Once it has the LLID, the monitoring system searches for the MAC address in the MAC-address-to-LLID mapping table. It does this because the user data frame MAC address indicates a router or terminal-like PC address, not the ONU ID. The system then counts the number of user data frames for every ONU MAC address that has the priority bit and shows the service status by the following algorithm. if { (user data frame counter number >= threshold value) In this way, the statuses of all active service classes for each ONU are detected and the system shows the current service statuses of every ONU on the display. 2.3 Display of resultsAn example of the monitoring results is shown in Fig. 3. “Fiber” indicates the number of ribbon fibers connected to the integrated distribution module coupler (or to the fiber terminating module). The “No.” column shows the number of active ONUs that share the ribbon fiber with same Number. The MAC addresses of ONUs, for which the monitoring system can detect the link status, are displayed in the “MAC address” column. If gigabit media converters are connected to the monitoring system, this is indicated by “GMC” in the “MAC address” column. The “ONU” column displays the ONU-OLT link status. The monitoring system displays “Active” when it detects an active link. “—” means inactive. The “Priority” column shows the monitored service status. “0” means a best-effort type service and “4” means the highest priority service (guaranteed VoIP (voice over Internet protocol)). The “Priority” column can display the eight service classes. The monitoring system can capture and display the realtime service statuses of each ONU. When a customer activates a service, the monitoring system displays the corresponding service status as “In use”. Otherwise, it displays “Standby”. In addition, when the ONU-OLT link is lost, the monitoring system displays all column entries as “—”.
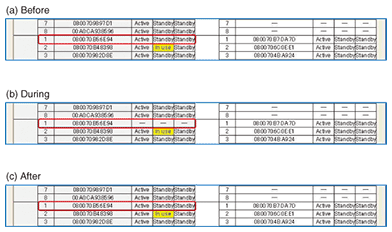
2.4 Usage exampleDisplay examples for the work for changing distribution fiber cables are shown in Fig. 4. Before starting the cable change work, the technician confirms that the monitoring system shows “Standby”, i.e., the customer (ONU) is not using any services at that time (Fig. 4(a)). The distribution fiber is disconnected. Upon fiber disconnection, the target ONU’s “ONU” and “Priority” columns turn to “—”, indicating the loss of the link (Fig. 4(b)). If the technician performs an improper operation, the links of other ONUs might be lost, but the monitoring system lets the technician detect this easily. After the cable connection has been changed, the ONU and the service statuses show “Standby” (Fig. 4(c)). If the cable change work is incomplete or wrong, the statuses will continue to be displayed as “—”. In this way, the technician can check the correctness of the work.
This monitoring system displays each ONU MAC address. However, in some cases, it would be more convenient for the technicians if IDs (for instance, customer ID) other than the MAC address were used. If an ID-and-MAC-address table file is prepared for the monitoring system, the technician can choose the most appropriate ID. 3. ConclusionWe have developed a monitoring system and tested it during FTTH engineering work in a central office. This system lets technicians performing engineering work observe the link and service statuses in real time and thus avoid mistakes like improper fiber disconnection and connection. The system also reduces the workload for confirming the results of engineering work because it provides realtime link status checks. Furthermore, its display of the realtime service statuses helps to avoid interruptions to services that are in use. References
|
|||||||


