 |
|||||
|
|
|||||
|
Special Feature on Technical Solutions to Real-world Problems Vol. 8, No. 9, pp. 4–7, Sept. 2010. https://doi.org/10.53829/ntr201009sf1 Wireless Local Area Network Monitoring ToolAbstractThis article introduces a wireless local area network (WLAN) monitoring tool that can simplify the monitoring of interference from industrial, scientific, and medical devices and allow the selection of a wireless channel with minimal interference from such devices to stabilize WLAN communications. This monitoring tool was developed by NTT EAST as an additional function to its WLAN troubleshooting tool, AirSpector, which can perform various types of troubleshooting for WLAN environments.
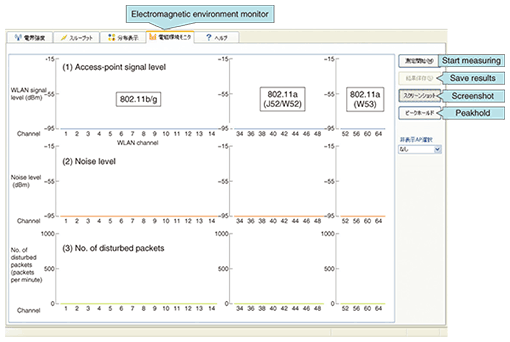
1. Benefits of WLAN monitoringA wireless local area network (WLAN) uses unlicensed frequency bands, which means that there are no restrictions on where WLAN access points can be installed. In particular, WLANs conforming to the IEEE802.11b/g standard use the 2.4-GHz band, which is also used by industrial, scientific, and medical (ISM) devices such as microwave ovens, wireless equipment, and medical instruments. Interference from such devices can lower throughput and degrade communications. When interference from ISM devices can affect a WLAN, the following measures are commonly taken. (1) WLAN and ISM devices installation locations are changed to establish sufficient distance between them and minimize the interference on the WLAN devices. (2) The channel used by a WLAN device is changed to one that does not overlap with an interfering frequency. (3) The transmission standard of the WLAN devices is changed from IEEE802.11b/g to IEEE-802.11a, and the 5.2-GHz band (J52/W52), 5.3-GHz band (W53), or 5.6-GHz band (W56) is used to avoid interference from ISM devices. However, interference from ISM devices is not something that can be visually observed by users or detected by the WLAN itself. Therefore, some means of checking for the presence of interference is needed to enable the abovementioned measures to be implemented. In response to this need, the Technical Assistance and Support Center at NTT EAST has developed a WLAN monitoring tool that can simplify the monitoring of interference from ISM instruments and other devices as an additional function to its WLAN troubleshooting tool, AirSpector [1], which can perform various types of WLAN troubleshooting. 2. Overview of WLAN monitoring toolA common technique for measuring electromagnetic waves that can interfere with a WLAN is to use a spectrum analyzer combined with an antenna. However, this technique requires specialized knowledge of measuring devices and methods. The WLAN monitoring tool introduced here requires only a notebook computer and WLAN card and can be used to check for the presence of interfering signals in a WLAN environment without specialized knowledge. The WLAN monitoring tool is implemented as an extension function of NTT EAST’s WLAN troubleshooting tool (AirSpector) and can be used to simultaneously measure the three parameters shown in Fig. 1. The characteristics of these parameters are summarized below.
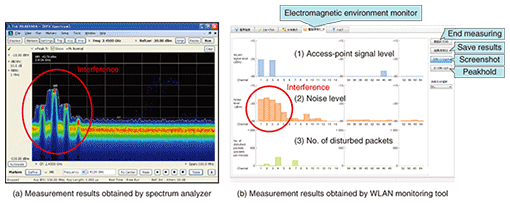
(1) Access-point signal level: The horizontal axis represents the WLAN channel and the vertical axis represents the power of signals received from nearby access points. This display can be used to check the usage state of each channel and determine which channels are free. (2) Noise level: The horizontal axis represents the WLAN channel and the vertical axis represents the power of interfering signals (noise) from ISM devices. This display can be used to check for channels having such interference. (3) Number of disturbed packets: The horizontal axis represents the WLAN channel and the vertical axis represents the number of lost packets (received packets with a cyclic redundancy check error) per unit time (one minute). Radio packets resembling WLAN communication signals (i.e., non-WLAN signals) that are received but cannot be demodulated are also counted as disturbed packets. In summary, this WLAN monitoring tool can be used to measure the usage state of each channel, check for the existence of interference, and count the number of lost packets per unit time. It enables the state of congestion and the existence of interference for each channel to be checked at a glance, making it easy to determine the optimum channel for any installation location. 3. Measurements with WLAN monitoring toolHere, we present two examples of using the WLAN monitoring tool to measure interference. 3.1 Interference from wireless cameraA wireless camera continuously transmits unidirectional video signals to a receiver. It will transmit radio signals unceasingly on various channels even if there is a WLAN in the area. On the other hand, a WLAN uses the carrier-sense function to check channel usage conditions before beginning a transmission. Thus, if a wireless camera is using certain transmit channels, the WLAN cannot even begin to transmit on those channels; this results in a significant drop in throughput or a failure to establish a connection between the terminal and access point. An example of interference from a wireless camera measured using a spectrum analyzer and the WLAN monitoring tool is shown in Fig. 2. The spectrum analyzer displayed signal level (vertical axis) against frequency (horizontal axis). As shown in Fig. 2(a), interference from the wireless camera had frequency components in the range from 2400–2430 MHz. This range corresponds to WLAN channels 1–5, and as shown in Fig. 2(b), noise level was high in these channels. Once the WLAN monitoring tool’s results had been obtained, a channel other than 1–5 was selected to minimize the effects of interference from the wireless camera. Of course, a spectrum analyzer can provide more accurate measurements of interference, but considering its relatively high cost and the need for an antenna, high-frequency cable, etc., the WLAN monitoring tool is a more user-friendly tool for maintenance personnel in the field.
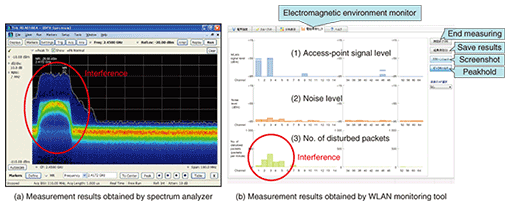
3.2 Interference from wireless TVIn contrast to a wireless camera, a wireless television (TV) performs bidirectional transmissions consisting of video and control signals that are exchanged between the TV tuner and main TV unit. However, radio packets exchanged between the tuner and TV unit resemble those of a WLAN, which means that WLAN throughput may drop if the transmit channels should overlap. On the other hand, interference from the wireless TV due to transmissions between the tuner and TV unit occurs intermittently, so this interference has less effect on the WLAN than that from a wireless camera. An example of interference from a wireless TV measured using a spectrum analyzer and WLAN monitoring tool is shown in Fig. 3. As shown in Fig. 3(a), interference from the wireless camera had frequency components in the range from 2400–2420 MHz, which corresponds to WLAN channels 1–4.
In this case, the WLAN monitoring tool could not detect the interference from the wireless TV as noise because it resembled the WLAN communication signals. To get around this problem, the tool detected this interference as radio packets that could not be demodulated and counted them as disturbed packets. In Fig. 3(b), channels 1–5 showed no significant increase in noise level compared with other channels, but the same range of channels did exhibit an increase in the number of disturbed packets. This demonstrated the existence of interference. In this case too, using channels having a small number of disturbed packets led to stable communications. 4. Future developmentsSince interference affecting WLANs is invisible to the naked eye, users can get frustrated in trying to identify the source of problems like no connection or degraded throughout. By adding a WLAN monitoring function to its WLAN troubleshooting tool (AirSpector), NTT EAST expects to make WLAN troubleshooting faster and even more efficient. Reference
|
|||||


