 |
|||||||||||||||||||||||||||||
|
|
|||||||||||||||||||||||||||||
|
Special Feature: Cutting-edge Technologies for Seeing and Showing Vol. 8, No. 11, pp. 24–29, Nov. 2010. https://doi.org/10.53829/ntr201011sf4 Topigraphy ProjectAbstractThis article introduces topigraphy, which is a novel method for displaying a large-scale tag cloud as a contour map of related tags. It uses a topographic image as a background picture on which the tag cloud is displayed. The Topigraphy project is supported two weblog (blog) navigation systems: BLOGRANGER TG and BLOGRANGER QA. We have also developed a three-dimensional visualization system and applications for smartphones using the Android operating system (Android OS).
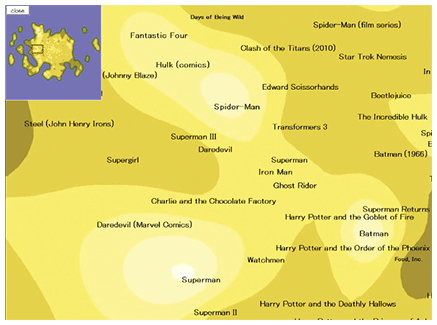
1. IntroductionThe tag cloud interface has recently become popular as another search interface, and many Web sites such as Flickr [1], delicious [2], and Technorati [3] use it. Tags are meaningful descriptors of objects and are usually provided manually by the large number of users. A tag cloud is a list of the most popular tags, usually displayed in alphabetical order, and visually weighted by font size. By just clicking on the tag of interest, a user can find relevant target objects. The tag cloud interface is useful when the list is sufficiently small; however, if it is too large, it becomes difficult to identify individual tags. Instead of the conventional tag cloud layout scheme, we have proposed a method for displaying a tag cloud called topigraphy (derived from topic + topography) [3]. Topigraphy uses a topographic image as the background on which a large-scale tag cloud (in excess of 5000 tags) is displayed as a contour map. The two-dimensional (2D) tag layout addresses tag similarities as semantically similar tags placed close to each other. The tag height or altitude represents the abstractness of the concept represented by the tag, so it provides a visual cue to the user about which tags are organized into semantic hierarchies. A user can enjoy spending time freely browsing and clicking through the 2D tag landscape and successfully discover objects of interest. 2. From searching to exploringAlmost all search engines display search results as an ordered list ranked by their relevance to the query. However, to get an optimal result with such systems, we must initially provide suitable key words. Therefore, we sometimes cannot obtain the best information. For example, to search for an interesting film, we usually enter the query film in the search engine. Then, the high ranks of the search results are filled with the definition of a film or information about major films. In some cases, we already know about these films and really want more information about films that are similar to our favorites. The topigraphic map (topigraph) of the film network generated from Wikipedia data enlarged around the Superman tag is shown in Fig. 1. If you like Superman or Batman and are searching for a similar film, you can spot some films related to them by exploring the map. In typical search tasks, high speed and accuracy of the search algorithm are of the greatest importance. In the Topigraphy project, however, we attach greater importance to exploring, i.e., discovering unanticipated information, than searching.
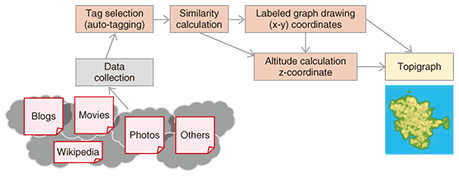
3. Topigraph constructionA flowchart for constructing a topigraph is shown in Fig. 2 and the steps are described in detail below.
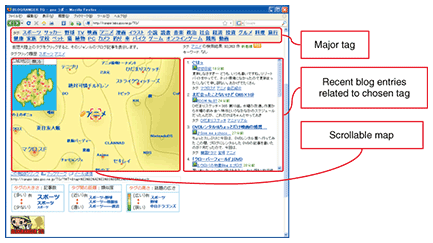
3.1 Data collectionTopigraphy can use any relational data such as weblog (blog) entries, movie contribution sites like YouTube [5], photo sharing sites like Flickr [1], and Wikipedia [6] data. Even if the content does not contain any tag data, we can still generate tags from entry texts, comments, or titles by using text mining and auto-tagging techniques. 3.2 Tag selectionNext, we extract significant tags from the data. While some users directly register a lot of meaningful tags, there are too many meaningless tags that are generated mechanically like registration time or weather information. Furthermore, even among the user-registered tags, there are many uninformative or irrelevant tags such as read later or interest. In BLOGRANGER TG (see section 4.1), to remove insignificant tags, we use an auto-tagging technique called the residual document frequency method [7] and use the titles of Wikipedia entries as a white list. 3.3 Similarity calculationTo measure the similarity of the extracted tags, we use several co-occurrence measures, such as the cosine and Jaccard coefficient. In this process, we also use Fisher’s exact test, which is a statistical hypothesis testing method, to remove noisy edges and select only significant edges from the large similarity network generated. 3.4 Labeled graph drawingIn topigraphy, tags with high similarity are located near each other. On the basis of the similarity, we can proceed to the (x, y) position calculation using the labeled graph drawing method that we recently proposed [8]. Most conventional algorithms compute node (tag) positions by treating nodes as points, i.e., tag size is not considered; consequently, there can be overlapping nodes. To remove this overlapping both efficiently and effectively, we propose a fast labeled graph drawing method called the individual ellipsoidal potential method, which takes the size and shape of each node label into account and avoids label overlap when generating a topigraph from tag data. Its parallel implementation on a GPGPU (general-purpose computing on graphic processing unit) lets us efficiently generate a large-scale high-quality tag cloud representation of 5000 tags taken from a tag co-occurrence network within 30 minutes. 3.5 Altitude calculationThe final step is to calculate the z-position (height) of a tag. Topigraphy introduces the tag height as a topographic expression. The tag height represents the abstraction level of each tag. For example, sports is more abstract than baseball or football and should be given a higher score. This lets the user grasp the relationship among tags intuitively and find related topics easily by tracking topigraphy ridges. To display the features, we have proposed a centrality score method [9], [10] based on the document frequency, user frequency, similarity, and Euclidean distance of the (x, y) position. The coordinates generated in the above steps are used to generate a smooth topigraphic surface through the use of the GMT application [11]. 4. Applications of topigraphyIn this section, we introduce some of the main applications of topigraphy. 4.1 BLOGRANGER TGWe have developed a blog navigation system called BLOGRANGER TG (hereinafter TG) to evaluate the feasibility and usability of topigraphy. We opened TG as a test run for one year from December 2007 at goo labs [12], which is an online laboratory. A screenshot of TG is shown in Fig. 3. TG automatically extracted about 5000 major and informative tags by analyzing 22 million Japanese blog entries collected during a period of four weeks. The topigraph of TG was updated weekly. It enabled users to grasp what was happening in the blogosphere at that time. Furthermore, TG’s application programming interface and blog parts were opened to blog users. These customizable options won high praise from users*.
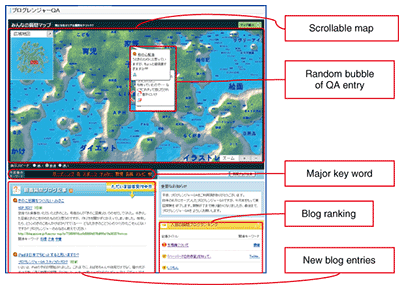
4.2 BLOGRANGER QABLOGRANGER QA (hereinafter QA) is a question-and-answer navigation system based on blog entries. It also had a one-year test run from July 2009 at goo labs. A screenshot of QA is shown in Fig. 4. QA tags were generated by the same method as in TG, but the tag score simply corresponded to the number of blog entries concerned with the particular tag. QA lets the reader directly answer a question entry by posting a blog entry through this system.
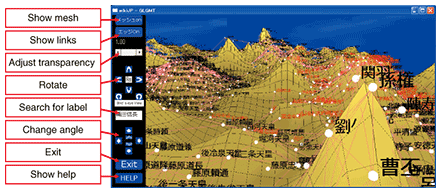
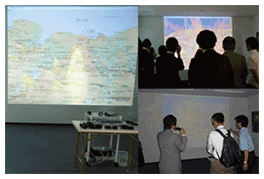
4.3 OpenGL & 3D displayBy using OpenGL, we developed a three-dimensional (3D) application of topigraphy (Fig. 5). The OpenGL version topigraph has additional functions. Show links can represent more specific relationships between tags. Rotate and Change angle let us view the data from various angles in 3D space. This application can also work in stereo. We can see a real 3D topigraph using a 3D monitor and a pair of 3D glasses. A demonstration at Open House 2010 of NTT Communication Science Laboratories is shown in Fig. 6. The display system, which ran on an NVIDIA 3D Vision device and used a 3D projector, let ten people experience 3D reviewing at the same time.
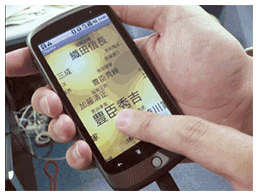
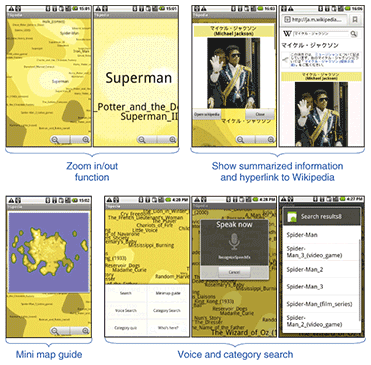
4.4 Topigraphy for AndroidA cell phone version of topigraphy for the Android operating system (Android OS) is shown in Fig. 7. Its functions include voice retrieval, zoom in/out, category retrieval, and a mini map guide, as shown in Fig. 8. This topigraph was created from a Japanese person name list obtained from Wikipedia data. If the tag is clicked, the summarized Wikipedia page will appear.
5. Future workWe are planning to launch the Android OS version and open the OpenGL version as free software. We will develop topigraphy-based navigation for a user-customizable interface for devices such as smartphones. References
|
|||||||||||||||||||||||||||||


