 |
|||
|
|
|||
|
Practical Field Information about Telecommunication Technologies Vol. 9, No. 2, pp. 80–85, Feb. 2011. https://doi.org/10.53829/ntr201102pf1 Troubleshooting User Systems in IP Services and Case StudiesAbstractThis article describes a method for troubleshooting user systems in Internet protocol (IP) services and presents case studies demonstrating its application. It is the third in a bimonthly series on the theme of practical field information about telecommunication technologies. This month’s contribution is from the Network Interface Engineering Group, Technical Assistance and Support Center, Maintenance and Service Operations Department, Network Business Headquarters.
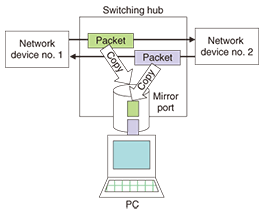
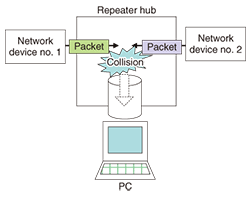
1. IntroductionInternet protocol (IP) services such as IP-phone and IP-TV have been growing rapidly. Although problems that occur because of faults in home devices or local area network (LAN) cables can be resolved by replacing them, problems caused by other factors have been increasing. This situation has generated a need to investigate the flow of packets exchanged in actual IP communications and examine the data in those packets. This article introduces a method for analyzing faults by capturing and analyzing packets and presents case studies demonstrating its application. 2. Packet capture methodA typical packet capture method is to insert a switching hub having a mirror port between network devices from which the target packets enter and leave and to connect the mirror port to a personal computer (PC) running packet capture software such as Wireshark (formerly known as Ethereal) in order to copy and grab the packets (Fig. 1). If a repeater hub is used for packet capture, one must keep in mind that packet loss can occur as a result of collisions since communication here is performed in half-duplex mode (Fig. 2).
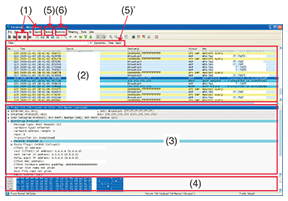
Here, we describe the basic functions of packet capture software using Wireshark (ver. 1.2.3), which has found widespread use as free software that can run on a variety of operating systems including Windows and UNIX (Fig. 3).
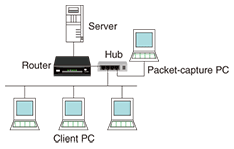
Items marked (1)–(6) on the operation screen of the packet capture software shown in Fig. 3 correspond to items (1)–(6) described below. (1) Packet capture start/stop The receive mode in performing packet capture is set to promiscuous mode in order to capture not only packets addressed to oneself but also those addressed to others. (2) Packet List pane This pane displays the receive time, transfer direction (source/destination addresses), type of protocol used, additional information, etc. about captured packets in the order in which they are collected. (3) Packet Details pane This pane expands parameters and displays details of the packet selected in (2) for each protocol layer. (4) Packet Bytes pane This pane displays the content of the packet selected in (2) as a hexadecimal dump and ASCII (text) display. For the parameter selected in (3), it displays the corresponding data in highlighted form. It also shows the address of this data within the packet (its byte from the front). (5) Packet Filter Since the packet capture process grabs all packets, the pane in (2) displays all of those packets including unneeded packets, which can be inconvenient in actual problem analysis. To alleviate this problem, the software enables only those packets of interest in problem analysis to be displayed by setting filtering conditions such as IP address or port number (display filter). For example, a filtering formula like “IP.addr= =192.168.1.1” can be defined and applied by using the Display Filter function from the pull-down menu or by entering it in the Filter toolbar on the operation screen ((5)’ in Fig. 3). (6) Packet statistics Packet statistics can be displayed to aid in understanding the traffic conditions in the communications environment being monitored. These include the number of sent/received packets, number of bytes, and bit rate, and so on for each protocol layer, each endpoint, and each set of endpoints. These statistics can also be displayed versus time in graph form. 3. Data analysis methodIn this section, we describe a method for analyzing captured data by referring to a case study. Packet capture can be performed between a router and client PCs to analyze the cause of delays that suddenly occur in network communications (Fig. 4).
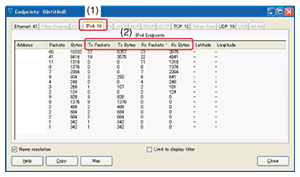
Specifically, to determine whether traffic is concentrating in a specific server or router, traffic statistics can be investigated from captured data in units of IP addresses. This is done by selecting Endpoints from the Statistics menu on the menu bar of the Wireshark operation screen to launch the Endpoints viewing screen. Then, by selecting the IPv4 tab on that screen ((1) in Fig. 5) and clicking on the Tx/Rx Packets (or Bytes) column ((2) in Fig. 5), one can obtain traffic statistics for each IP address ranked in order of highest traffic volume (Tx: transmitted, Rx: received).
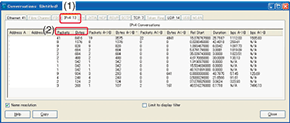
The ranking described above enables the user to determine whether traffic is concentrating in a specific server or router. Next, to determine whether any of the endpoints from among those communicating with one of the above servers or routers has a particularly large traffic volume, one can investigate traffic statistics from captured data in units of communications between end points. With Wireshark, for example, this is done by selecting Conversations from the Statistics menu on the operation screen to launch the Conversations viewing screen. Then, by selecting the IPv4 tab ((1) in Fig. 6) and clicking on the Packets (or Bytes) column ((2) in Fig. 6), one can get traffic statistics for pairs of endpoints in order of highest traffic volume.
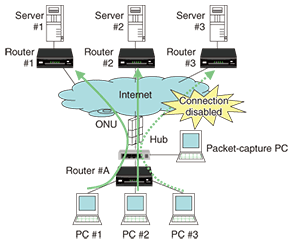
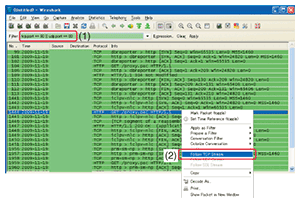
In this way, one can assess which pairs of network devices have a large traffic volume and whether they are monopolizing network bandwidth. At this time, the TCP (transmission control protocol) or UDP (user datagram protocol) tab can be selected and Packets (or Bytes) clicked to obtain traffic statistics for each port. This lets one investigate which ports are experiencing high traffic, and if the port number in question has a value of “0–49,151” (where 0–1023 are Well Known Ports and 1024–49,151 are Registered Ports) to identify the application being used by referring, for example, to the Internet Assigned Numbers Authority (IANA) site. So far, we have described cases in which the cause of problems is traffic concentration between specific parties communicating between specific network devices. We now describe an analysis method that probes as far as packet content to determine whether an anomaly has occurred in packets or communication sequences in IP-packet communications between a server and client PCs. We take as an example the inability to make an Internet connection (assuming that DNS (domain name system) name resolution is operating normally). In Fig. 7, a connection cannot be made from PC #3. Therefore, to check whether HTTP (hypertext transfer protocol) communication (port number = 80) is being performed normally from this and the other PCs as well, a hub is inserted between the optical network unit (ONU) and router #A in the figure and a packet-capture PC is connected. Then, after the packet data collected by Wireshark has been expanded, only that corresponding to HTTP communications is displayed by selecting Filter = “TCP or UDP port is 80 (http)” prepared as a default in Display Filters of the Analyze menu or by directly entering “tcp.port= = 80|| udp.port==80” into the Filter toolbar on the operation screen ((1) in Fig. 8). This procedure lets one assess whether all HTTP communications have failed or only those of a particular site.
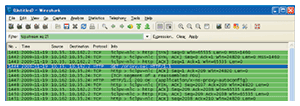
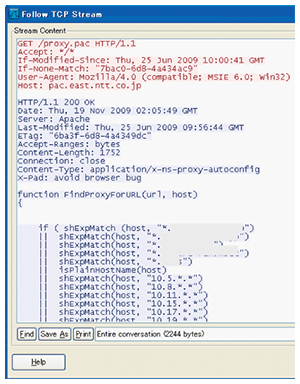
If it is now assessed in the above way that anomalies have occurred in only HTTP communications between PC #3 and server #3 in Fig. 7, then displaying only that TCP session will facilitate the analysis process. This is done by making any packet within that TCP session into an active display and then right-clicking and selecting Follow TCP Stream ((2) in Fig. 8), which causes all packets in that session to be automatically extracted and displayed (Fig. 9) simultaneously with the content of HTTP communications from GET requests to success replies (200 OK) (Fig. 10). Analysis can therefore proceed in an efficient manner while the communication sequence and packet contents of a particular communications session are being checked. This procedure also makes it possible to check the TCP session for segment loss on the server side or problems in HTTP communications on upper-level web servers.
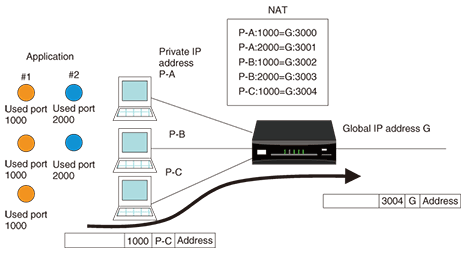
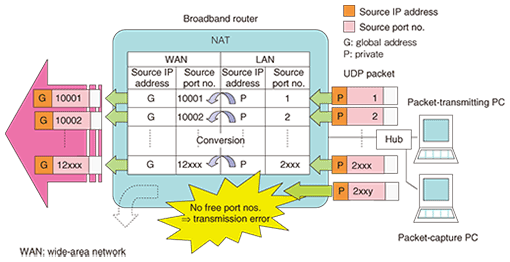
4. Case study reflecting a typical problemIn recent years, there has been a dramatic increase in the popularity of peer-to-peer (P2P) file sharing software and online games. In the former case, a large number of users download and upload large quantities of files from and to each other over the Internet, and in the latter case, many users compete with each other over the Internet. This flourishing of applications that exploit the inherent convenience of the Internet to the limit is being accompanied by performance demands on routers and other devices on the customer’s premises that could not be envisioned in normal use. As a result, problems caused by processing capacity limits and resource depletion have begun to appear. Here, we present a case study obtained from consultations made with the Technical Assistance and Support Center. A customer who uses online games occasionally experienced the phenomenon in which the console’s screen suddenly froze and the Internet connection was lost. The same customer also uses P2P file sharing software. When the communications log of the broadband router was checked, it was found that a transmission error occurred in conjunction with the network address table (NAT) in the time period during which the problem occurred. The NAT dynamically converts IP addresses and port numbers so that multiple applications can run simultaneously on multiple PC terminals using a single global address (Fig. 11). The details of this error indicated that the number of entries registered in the NAT exceeded the table’s capacity, which suggested that the address/port conversion pattern could not be registered in the NAT. To test this hypothesis, we connected a PC to that broadband router, and using a packet-transmission program that we created, we transmitted IP packets continuously while incrementing the destination port number by one for each packet. In this way, we could check whether the same kind of transmission error would occur in the broadband router (Fig. 12). At this time, we also set up one more PC between the packet-transmitting PC and broadband router to perform packet capture.
We found from the communications log that a transmission error occurred at the NAT after the destination port number on the LAN side entered the 2000 series. Thus, to determine the maximum number of entries that could be registered in the NAT, we divided captured data into port number ranges in the manner of port no. = 1–2750, 1–2500, 1–2250, etc. and using a PC packet-generator tool, we transmitted that data in sequence to the broadband router and checked for a transmission error. We found that a transmission error did indeed occur upon exceeding port no. = 2XXX and that the maximum number of entries for the NAT was therefore 2XXX. On the basis of this case study, we could infer that performing large-volume TCP/UDP communications simultaneously by online games and P2P-type file sharing software caused the number of NAT registration entries to reach 2XXX so that subsequent communications failed owing to insufficient NAT capacity. We could also infer that this problem could be solved by replacing the broadband router with another model having a larger NAT capacity or by changing the settings of the customer’s P2P file sharing software. 5. ConclusionIn this article, we introduced a troubleshooting method targeting user systems in IP services and presented case studies of its use. We hope that readers found this article useful and interesting. |
|||


