|
|||||||||||||||||||||||
|
|
|||||||||||||||||||||||
       |
Feature Articles: Imaging and Sensing Technologies for Safety and Security Vol. 10, No. 2, pp. 32–37, Feb. 2012. https://doi.org/10.53829/ntr201202fa6 Visualization of Pharmaceutical Drug Molecules by Terahertz Chemical ImagingAbstractTerahertz spectroscopy allows the detection and identification of various molecular networks of chemical bond interactions, including those of hydrogen bonds. In this article, we explain terahertz time-domain spectroscopy, the principles of terahertz chemical imaging, and a multicomponent quantitative analysis method for amino acids that can visualize pharmaceutical crystalline polymorphs as an example of this technology. 
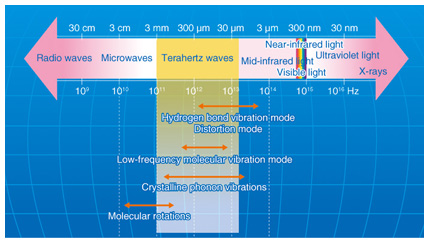
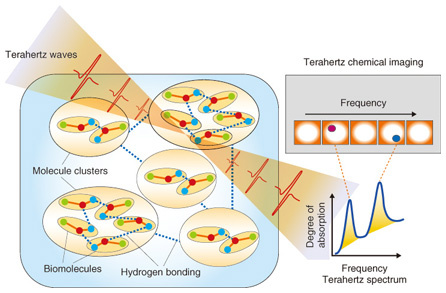
1. IntroductionTerahertz waves (THz-waves), which possess an energy level between that of radio waves and light waves, can provide various types of information, including crystal phonon modes, low-wavenumber frequencies, and gas molecule rotation modes. The specific absorption frequencies of a chemical substance are shown in Fig. 1 [1]. Mid-wavelength infrared absorption spectroscopy deals with the high-frequency vibration mode, so it can identify the functional groups of molecules. By contrast, terahertz spectroscopy can determine low-frequency vibration modes such as those existing in van der Waals interactions and hydrogen bonding. Terahertz peaks appear owing to resonance in the hydrogen bonds in most amino acid crystals. Terahertz spectroscopy can identify various types of information from molecular networks, including biomolecules dissolved in aqueous solution, organic molecular crystals, higher-order protein structures, and the DNA (deoxyribonucleic acid) double helix. The hydrogen bonding of biomolecule clusters and molecular networks in water is shown in Fig. 2. From the terahertz spectrum, we can obtain the continuous frequency corresponding to each individual peak; that is, we can obtain the chemical image. Molecular clusters may contain pharmaceutical drug molecules and hydrogen molecules, amongst others. These molecular networks are important in the biomedical field because they can influence the effectiveness of medicines. However, the details of molecular networks are difficult to obtain because the cluster size is on the nanometer scale and there are few methods for measuring such sizes accurately, particularly when the cluster includes water as a component.
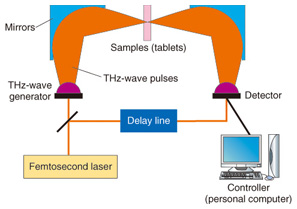
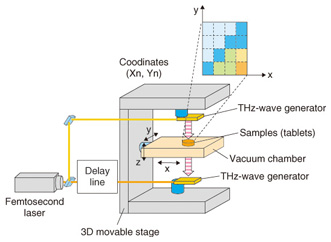
The resonance frequency of molecular networks is in the terahertz band, which makes such networks amenable to terahertz spectroscopy and imaging. Terahertz spectroscopy is a useful tool that can identify hydrogen bonds present in molecules that comprise various bio-specimens, including organic acids, amino acids, sugars, drugs, polypeptides, DNA, and proteins as well as macrostructures such as cancer cells. Since most amino acids and pharmaceutical drug molecules contain hydrogen bonds, quantitative analysis from terahertz spectrum peaks is possible. The applications of terahertz spectroscopy are wide ranging and many practical uses are expected. In addition to fundamental research applications such as pathology testing or the identification of different types of explosives, other applications of the technology have been receiving attention. In contrast to X-ray imaging, terahertz chemical imaging (TCI) can identify molecules by their molecular network spectrum. Because the technique can reveal the molecular network rather than only the molecular distribution, we believe that TCI can provide a new method for both drug identification and pathological examination. Terahertz waves penetrate many types of materials and can be used to confirm molecular uniformity as well as to identify crystal polymorphs. Crystal polymorphism arises from different types of hydrogen bonding occurring within crystals and can lead to differences in physical and chemical properties, including differences in solubility, melting point, and bioavailability. Bioavailability, rather than describing physiochemical properties of pharmaceutical drug molecules, describes the way in which chemicals are absorbed in the human body and is important in determining the effective dosages of particular medications. 2. Principle of terahertz time-domain spectroscopy (THz-TDS) and THz-TDS systemTerahertz time-domain spectroscopy (THz-TDS) is the most popular type of terahertz spectroscopy. Advances in terahertz technology have allowed the commercialization of THz-TDS, which is also beginning to be recognized as a new analytical chemistry method. A THz-TDS system involves coherent signal generation and detection. The terahertz pulse repetition frequency is around 80 MHz. A typical THz-TDS system configuration is shown in Fig. 3 [2]. An ultrashort (10–100 fs) laser pulse is split so that both the terahertz generator and receiver are irradiated. The most common terahertz generator and receiver is a photoconducting antenna. A sub-picosecond terahertz pulse wave irradiates the sample and when it propagates, the electric field strength changes. Rather than measuring the light intensity in the frequency domain, we use the time domain to measure the electric field strength. The measurement of terahertz waves in the frequency domain usually uses a delay line. Repetitive terahertz pulse waves are measured and converted into intensity and phase by Fourier transformation. THz-TDS can be performed at room temperature and it has better sensitivity than far-infrared spectroscopy for frequency domain measurement. An example of a TCI system using THz-TDS and a stage that can be moved in three dimensions is shown in Fig. 4 [3]. While the stage is scanned, the waveform of the terahertz pulse wave is measured and recorded and then the Fourier transform is used to change each frequency. Samples such as medicinal tablets are fixed in a vacuum chamber, which can attenuate the absorption of atmospheric water.
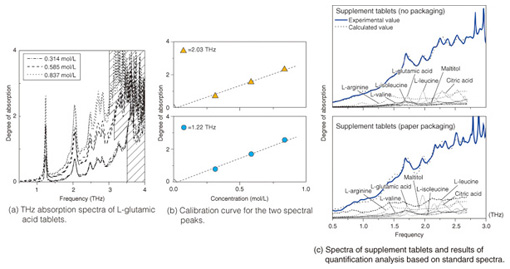
3. Quantitative chemical analysis by THz-TDSUntil now, there has been no discussion of the quantitative relationship between the degree of absorption (absorbance) gained from THz-TDS and the sample concentration or sample optical path length measured from actual spectra. To illustrate the usefulness of THz-TDS as a general analytical sensing method, it is necessary to conduct a quantitative discussion of the relationship between absorbance and sample concentration or sample optical path length and the relationship between noise level and detection limit, in parallel with qualitative discussion of the terahertz absorption peaks. The absorption spectra of three different concentrations of medicinal tablets that include crystals of the essential amino acid L-glutamic acid are shown in Fig. 5(a) [4]. Amino acid crystals form a stable crystal structure via hydrogen bonding among amino acid molecules or bonding between amino acid molecules and hydrated water molecules. It is believed that multiple instances of hydrogen bonding exist between molecules, which can be reflected in a single spectrum. The calibration curves for the two main peaks are shown in Fig. 5(b). The peak intensity (including background absorption) is proportional to the concentration, which shows that quantitative analysis is possible. To determine the types of different amino acids present, we calculated the molar absorption coefficients in the region from 0.5–3.0 THz. These coefficients were then used as the standard spectra. We then carried out quantitative chemical analysis of sample tablets containing a mixture of several amino acids. The upper part of Fig. 5(c) shows the spectrum of commercially available supplements containing various types of amino acids [5]. Five types of amino acid were detected, including L-glutamic acid, and L-leucine, and the concentration of each amino acid could be quantified by automatic analysis using a standard spectrum database. The lower part of Fig. 5(c) shows the spectrum and analysis result for pills wrapped in medical paper made from starch. Since THz-waves have high permeability for such substances even when they are wrapped in medical paper, there was almost no resulting effect on peak position and strength, and quantitative analysis was possible with standard spectra. We expect the quantitative accuracy to improve in the future as the database quality and the fitting techniques are improved.
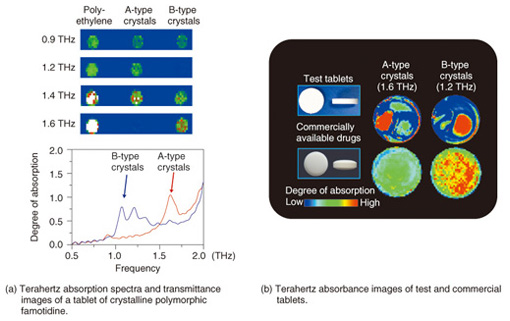
4. Visualization of pharmaceutical drug molecules by TCITCI technology can identify the two- or three-dimensional distribution of each type of molecule on the basis of the molecular network as well as molecular concentrations from the terahertz absorption spectrum. An example of an application to pharmaceutical drug molecules—identification of two polymorphs of famotidine, which is a component of stomach medicine and a histamine receptor antagonist (H2 blocker)—is shown in Fig. 6.
The absorption spectra of tablets containing the A-type and B-type crystalline polymorphs of famotidine with polyethylene binder as well as transmittance TCI images are shown in Fig. 6(a) [6]. Type B is a digestive-tract medicine that works as a histamine H2-receptor antagonist. Types A and B are easily identified in the terahertz spectrum because there are differences in their absorption peaks. Absorption images of the test tablets, which exhibited the characteristic A-type and B-type peaks, and of commercial drug tablets are shown in Fig. 6(b) [7]. The A-type and B-type tablets were 10 mm and 7.6 mm, respectively, in diameter. Types A and B showed peaks close to 1.6 THz and 1.2 THz, respectively. In the test tablets, regions of A type on the left and regions of B type on the right could be clearly identified. By contrast, in the commercial drug tablet images, there is almost no A type, whereas B type is widely distributed as the active ingredient. This is the first time that pharmaceutical drug crystal polymorphs have been visualized inside tablets. There are several tablet molding methods, so the method used for molding the test tablets investigated here may not be used for all tablets in practice; nevertheless, it is very important to pioneer new testing methods while achieving the desired goal of pharmaceutical product safety. 5. ConclusionWe introduced molecular pharmaceutical drugs and supplements as examples of substances suitable for quantitative analysis by terahertz spectroscopy and chemical imaging. Even though the number of researchers involved in terahertz wave technology has increased markedly in recent years, potential applications of terahertz wave chemical analysis are only just being identified. The reasons for this include, but are not limited to, the difficulty in measuring the 1–3-THz range, which is effective for detecting hydrogen bonding and molecular networks, the fact that a theory for terahertz spectral analysis methods has not yet been established, the complexity of THz-TDS spectral analysis, and the cost of the equipment used. Nevertheless, the ability of terahertz waves to visualize new structures and interactions that were previously unobservable is a powerful tool in the fields of biology, medicine, and life sciences. In future, we would like to continue exploring and developing this revolutionary technology. References
|
||||||||||||||||||||||