|
|||||||||||||||||||||||||||
|
|
|||||||||||||||||||||||||||
       |
Regular Articles Vol. 10, No. 6, pp. 21–27, June 2012. https://doi.org/10.53829/ntr201206ra1 4.6-μm-band Light Source for Greenhouse Gas DetectionAbstractThis article describes a compact mid-infrared light source based on difference-frequency generation with a quasi-phase-matched LiNbO3 waveguide for detecting N2O gas. We obtained stable output power of 0.62 mW with an internal conversion efficiency of 5.9%/W for a 4.6-μm-band continuous-wave light source operating at room temperature. We demonstrated that this light source enables successful detection of N2O gas at concentrations as low as 35 parts per billion. This light source is promising for highly sensitive in-situ continuous monitoring of N2O, and it is also applicable to the detection of other greenhouse gases.
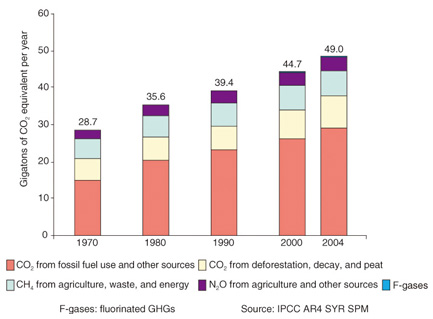
1. IntroductionLight sources in the mid-infrared (mid-IR) range are attractive for sensing trace gases. Many gases, including greenhouse gases (GHGs), exhibit strong absorption in the mid-IR range, especially from 2 µm to 5 μm, because their fundamental and rovibrational (coupled rotational and vibrational) modes are in this range [1]. The absorption intensities of such gases in the mid-IR range are higher than those in the near-IR range by a factor of 100 to 10,000. Therefore, mid-IR light sources have a strong advantage for highly sensitive and in-situ detection of GHGs. For these applications, mid-IR light sources based on difference-frequency generation (DFG) in quasi-phase-matched (QPM) lithium niobate (LiNbO3 (LN)) are promising because they can provide continuous-wave (CW) mid-IR light in the wavelength range from 2 µm to 5 μm and operate at room temperature. A high conversion efficiency can be achieved by using a waveguide structure, so we can obtain sufficient mid-IR output power [2]. With this structure, we have achieved high conversion efficiencies of 40%/W, 87%/W, and 100%/W for 3.2-µm, 2.7-µm, and 2.3-μm light sources, respectively [3]–[5]. In this article, we focus on the detection of nitrous oxide (N2O), which is one of the major GHGs. N2O exhibits a strong greenhouse effect, even though its concentration in the atmosphere (322 parts per billion (ppb)) is low compared with carbon dioxide (385 parts per million (ppm)) and methane (1800 ppb). The atmospheric N2O concentration has increased almost linearly at a rate of 0.8 ppb/year for decades. The most recent concentration measurement of 322 ppb in 2010 is about 19% higher than that in the preindustrial era. Because N2O has a long lifetime in the atmosphere, it will take a long time for its atmospheric concentration to fall. Furthermore, N2O emissions in 2004 were 62.5% higher than in 1970 and accounted for 7.9% of the total anthropogenic GHG emissions in terms of carbon dioxide equivalents. Global annual emissions of anthropogenic GHGs from 1970 to 2004 are shown in Fig. 1 [6]. To enable us to prevent increases in atmospheric N2O concentration, we need to monitor N2O emissions. A detection limit as low as a few tens of parts per billion is desirable for N2O monitoring because the concentration of atmospheric N2O is very low. Since N2O gas exhibits its strongest absorption band in the 4.6-μm region, a 4.6-μm-band CW light source is suitable for in-situ continuous emission monitoring [1].
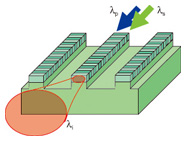
In this article, we describe a QPM-LN waveguide light source with a high conversion efficiency for N2O gas detection. We introduce its operating principle and fabrication technique. We also present experimental results for N2O detection with the light source and discuss the detection limit. 2. Principle of wavelength conversionMid-IR light in the 4.6-μm-band is generated by wavelength conversion based on DFG, which is a second-order nonlinear optical effect. For the DFG, a difference-frequency light, called the idler light, is generated from two input lights, which are called the pump and signal lights. When the pump light with wavelength λp = c/νp and the signal light with wavelength λs = c/νs are launched into a nonlinear optical crystal, the idler light with wavelength λi = c/νi (νi = νp - νs) is generated by the DFG process, where c is the velocity of light and ν is its frequency. This can be expressed using wavelength as 1/λi = 1/λp - 1/λs. (1) Various wavelength ranges of mid-IR light can be generated by choosing appropriate wavelength combinations of pump and signal lights from commercially available near-IR telecommunications laser diodes (LDs). To achieve efficient wavelength conversion from the interaction of the above-mentioned three waves, it is essential to satisfy the phase-matching condition. In most nonlinear crystals, this condition can be satisfied by only a limited number of combinations of wavelength and polarization. Quasi phase matching relaxes the phase matching constraint and allows the wavelength conversion of arbitrary wavelength combinations. It is achieved by a periodically poled structure whose spontaneous polarization directions are reversed with period Λ with respect to the light propagation direction in the nonlinear crystal. This technique allows us to obtain conversions of various wavelength combinations simply by designing different poling periods. A DFG device using a QPM-LN waveguide is shown schematically in Fig. 2. Efficient wavelength conversion is achieved by satisfying the quasi-phase-matching condition (Δβ = 0), where the phase mismatch Δβ is defined by Δβ = 2π[np/λp - ns/λs - ni/λi - 1/Λ]. (2) Here, np ns, and ni are the refractive indices at the wavelengths of λp, λs, and λi, respectively. On the basis of a small signal approximation, where the attenuation of the two input light powers Pp and Ps is negligible, the converted light power Pi is given by Pi = ηPpPs/100, (3) where η (%/W) represents the conversion efficiency and is given by η = ηmaxsinc2[ΔβL/2] (4) and ηmax ∝ L2/Aeff. (5) The conversion efficiency η becomes constant (η = ηmax) when the phase mismatch is equal to zero. Therefore, the power of the converted light Pi increases in proportion to input powers Pp and Ps. Furthermore, Pi is proportional to the square of device length L and the inverse of effective interaction cross-section Aeff.
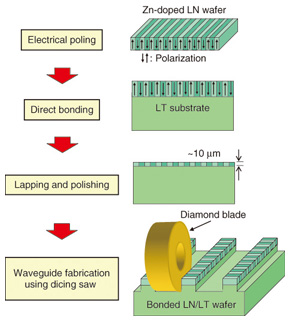
3. QPM-LN waveguide module3.1 Waveguide fabricationTo reduce Aeff and thereby achieve efficient wavelength conversion, it is effective to use a waveguide structure because the three interacting lights are confined in a small core area. Our QPM-LN waveguide fabrication is based on direct bonding [7]. The fabrication process is shown in Fig. 3 [2]. We used Zn-doped LN as a core layer and lithium tantalate (LiTaO3 (LT)) as a cladding layer. First, we made a periodically poled structure on an LN wafer by using a conventional electrical poling method. We then brought two wafers into contact in a clean atmosphere and annealed them at 500°C to achieve complete bonding. Next, the thickness of the core layer was reduced to around 10 µm by lapping and polishing. Then, the ridge structure was fabricated using a dicing saw. The waveguide was cut at an angle to prevent undesired back reflection. The Zn-doped LN core layer makes our waveguide highly resistant to damage. Moreover, because direct bonding does not use any adhesives, the fabricated waveguide is transparent in the mid-IR range and has better long-term reliability than ones made using adhesives.
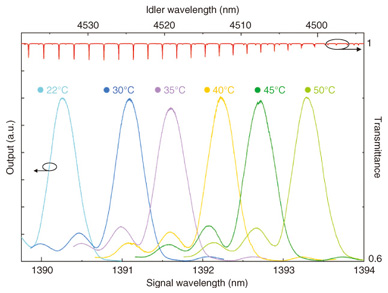
3.2 Module design and DFG performanceThe fabricated waveguide was assembled in a fiber pigtail module package. The module is 12 mm thick, 30 mm wide, and 73 mm long. To excite the transverse magnetic mode of the waveguide, we used a polarization-maintaining fiber as an input fiber. The module has a Peltier element and a thermistor to control the waveguide temperature. The phase-matching wavelength can be tuned by controlling the temperature. The pump and signal lights from the input fiber were coupled by a set of lenses to prevent heat damage to the connection area at high input power. This enables us to inject 1.064-μm-band pump light of high power, which is amplified by an ytterbium-doped fiber amplifier (YDFA). The DFG tuning curves at various LN waveguide temperatures as a function of signal wavelength when the pump wavelength was 1.06396 μm are shown in Fig. 4. The corresponding N2O gas absorption lines calculated from values in the HITRAN (high-resolution transmission molecular absorption) database [1] are shown at the top of the graph. We could tune the phase-matching wavelength to a suitable absorption line for detection from among more than a dozen ones by controlling the waveguide temperature and the pump and signal wavelengths. We obtained CW mid-IR output with power of 0.62 mW at an internal conversion efficiency of 5.9%/W as typical properties when the pump and signal powers measured at the waveguide output side were 507 mW and 20.5 mW, respectively.
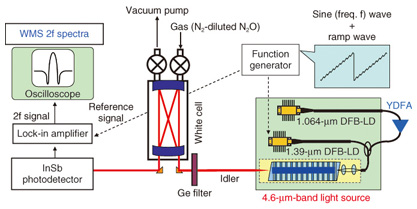
4. Light source and experimental setupThe experimental setup is shown schematically in Fig. 5. We fabricated a 4.6-μm-band light source for detecting N2O gas. The source is compact and reliable. It consists of two LDs, a YDFA, a wavelength division multiplexing fiber coupler, and a QPM-LN module. A 1.064-μm-band distributed feedback laser diode (DFB-LD) and a 1.39-μm band DFB-LD were used to generate the pump light and signal light, respectively. We used wavelength modulation spectroscopy (WMS) to obtain high sensitivity [8]. A 14-kHz sine wave superimposed on a 0.7-Hz ramp wave was generated by a function generator and injected as a forward current into the DFB-LD with a wavelength of 1.39 μm. Current modulation of the signal light LD enabled us to obtain stable WMS spectra. The main component of the detection equipment was a White cell with a 16-m optical path. The sample gases were N2-diluted N2O gas and N2-diluted air. The mid-IR light output from the cell was received by an InSb photodetector. We could align the output beam effectively by utilizing near-IR pump and signal outputs instead of the mid-IR output, which is difficult to visualize. The output signal from the photodetector was detected with a lock-in amplifier. The WMS spectrum consists of the second-harmonic (2f) component of the modulation frequency, which was derived from the lock-in amplifier.
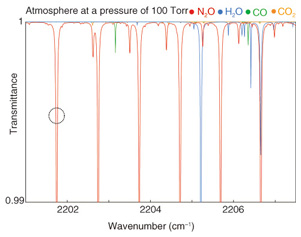
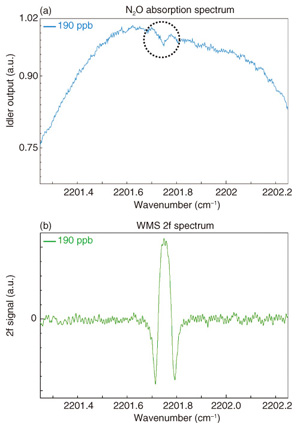
5. N2O detection using new light source5.1 Absorption line of N2O and detection technique comparisonSimulated optical transmittance results, which were calculated from HITRAN database values, for a pressure of 13.3 kPa and an optical path length of 10 m for atmospheric gases in the 4.6-μm-band range are shown in Fig. 6. Absorption lines from N2O, water (H2O), carbon monoxide (CO), and carbon dioxide (CO2) can be seen. We selected the absorption line at 2201.75 cm-1 for N2O measurement to avoid interference from the absorption lines of other gases. To obtain accurate values of gas concentration, it is preferable to perform N2O measurement with the pressure reduced to 13.3 kPa because overlapping adjacent absorption lines are separated without any reduction in the absorption amount. We compared the WMS method with direct absorption measurement using the same absorption line at a gas concentration of 190 ppb. As shown in Fig. 7, the signal-to-noise ratio was improved by using the WMS method, and this allows us to achieve higher sensitivity.
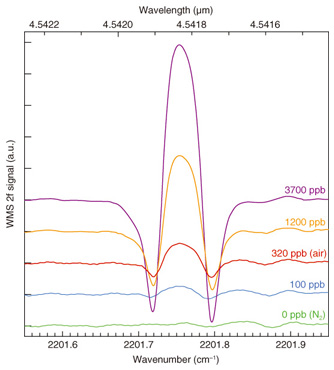
5.2 N2O WMS spectra and detection limitThe N2O WMS 2f spectra at various N2O concentrations are shown in Fig. 8. The input pump and signal powers were 200 mW and 40 mW, respectively. The red and blue lines are spectra at N2O concentrations of 320 and 100 ppb, respectively. These spectra indicate that atmospheric N2O concentration can be clearly detected and that N2O concentrations lower than 100 ppb are detectable with this 4.6-μm-band light source.
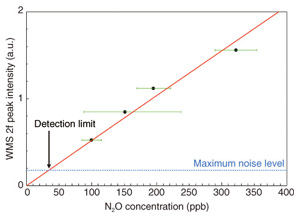
To convert the WMS 2f signal into N2O concentration, we used the WMS 2f peak value from the zero line. The WMS 2f peak intensities in the low-concentration range as a function of N2O concentration are shown in Fig. 9. We defined the detection limit as the maximum noise level of measured spectra, which means that the limit is the concentration at which the signal-to-noise ratio is 1. The solid and broken lines in Fig. 9 correspond to the fitting curve and the maximum noise level, respectively. From the concentration at their crossing point, we found that the detection limit was 35 ppb, which corresponds to one-tenth of the atmospheric N2O concentration. This result suggests that this light source is suitable for high-sensitivity in-situ monitoring of N2O and is promising for monitoring other GHGs. The setup described above is also promising for N2O measurements with a concentration resolution of around 100 ppb in the fields of agriculture and animal husbandry. Further improvements in sensitivity will be achieved by increasing the input pump power to 1 W and reducing the noise caused by the photodetector.
6. ConclusionWe have developed a 4.6-μm-band mid-IR light source based on DFG for N2O gas detection. This is a reliable and compact light source that uses a QPM-LN waveguide module and two near-IR telecommunications LDs. We obtained stable CW output at a power of 0.62 mW and an internal conversion efficiency of 5.9%/W as typical properties. We successfully demonstrated N2O gas detection with this light source. The high sensitivity is attributed to lens coupling and to the WMS technique for detection. We obtained a detection limit of 35 ppb for N2O detection. The DFG-based mid-IR light source using a QPM-LN waveguide can cover wavelengths up to about 5 µm, to which LN is transparent. This light source is promising for highly sensitive in-situ continuous monitoring of N2O and other GHGs. References
|
||||||||||||||||||||||||||