|
|||||||||
|
|
|||||||||
       |
Regular Articles Vol. 10, No. 12, pp. 68–74, Dec. 2012. https://doi.org/10.53829/ntr201212ra1 Advertising Effectiveness Measurement Using Crowd Measurement and Facial Image Processing TechniquesAbstractAs digital signage becomes more common, there is increasing need for camera-based techniques that can measure the effectiveness of advertising. NTT is researching and developing 1) a crowd measurement technique to measure the number of people at a location; 2) a transient-audience measurement technique to measure the number of people passing through that location; and 3) a face detection, orientation estimation, and attribute classification technique to detect faces in an image and estimate the age and sex of each person. Version 3 of our advertising effectiveness measurement system combines these three techniques.
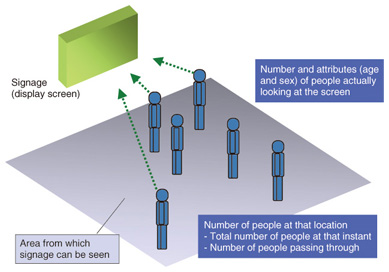
1. IntroductionDigital signage is rapidly becoming common at places where people gather, such as stations and commercial facilities, as a tool for providing services such as information guides and advertising. Its usage formats have recently diversified to include studies on its application as a means of providing information during disasters, and digital signage is expected to permeate all aspects of our lives in the future [1]. Concerning the spread of digital signage, we are seeing the start of advertising distribution in a format in which the media companies that own the signage sell advertising spots (locations and times for displaying ads) and advertisers purchase those spots to display their ads. This is raising questions about how much effectiveness can be expected for a given expenditure and whether the resultant effectiveness matches expectations, so it has become necessary to measure and comprehend the advertising effectiveness of digital signage. In simple terms, advertising effectiveness has many facets, such as the exposure effectiveness (how many people does the advertising reach), perception effectiveness (what impressions and information are given to the audience), and action effectiveness (by how much does the number of customers or sales volume increase), which are similar to television program viewing rate and website page views. Of these, exposure effectiveness is thought to be a basic and also common index as a foundation for comprehending advertising effectiveness. For digital signage, exposure effectiveness is assumed to be information such as the number of people at that location—the total number of people at a given instant (total audience) and the number of people passing through (transient audience)—and, of those, the number of people actually looking at the screen and their attributes (sex and age) (Fig. 1).
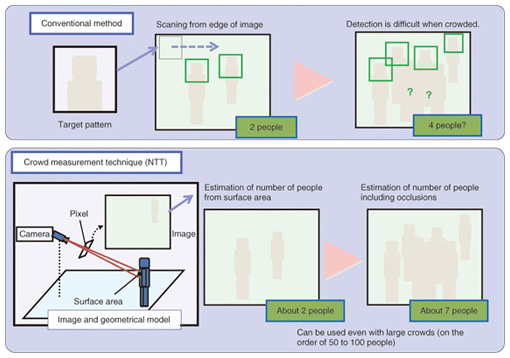
NTT has developed three techniques that use images captured by cameras with the aim of applying them to the measurement of digital signage advertising effectiveness: 1) a crowd measurement technique [2] that measures the total number of people at a location, 2) a transient audience measurement technique that measures the total number of people passing through that location, and 3) a face detection, orientation estimation, and attribute classification technique [2] that detects faces in an image and estimates the orientations of those faces and the age and sex of those people. The latest version V3 (version 3) of our advertising effectiveness measurement system integrates these techniques. Below, we overview these image processing techniques and our advertising effectiveness measurement system V3. 2. Image processing techniques2.1 Crowd measurement techniqueThe crowd measurement technique developed at NTT can measure the total number of people within an image at the instant it was acquired. Previous techniques for measuring the total number of people in an image generally involve detecting specific shapes such as the whole body or upper half of each person in an image, or following individual moving objects within a series of images (using a tracking technique), or a combination of those. However, those previous techniques can suffer from occlusion, whereby one person is superimposed on another in the image, as shown in the upper part of Fig. 2, which makes correct detection difficult. For that reason, previous techniques have the problem that they can be applied only to comparatively limited numbers of people (such as about 5–10).
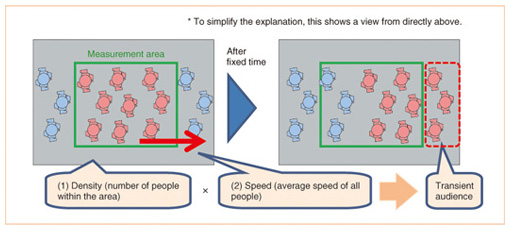
NTT’s crowd measurement technique [2] estimates the total number of people within an image in a manner that avoids the effects of occlusion by utilizing the area of an image. It works by modeling the geometrical relationships between the camera, floor, and people and the geometrical relationships between them in the image, as shown in the lower part of Fig. 2. This approach is completely different from those of previous techniques in that it does not detect each person individually, but makes it possible to estimate approximately how many people are there overall. The features of this technique are that it can estimate the number of people in a crowded situation and it enables the use of general-purpose cameras that are pointing obliquely downward. A more detailed description is given in Ref. [3]. 2.2 Transient audience measurement techniqueTransient audience measurement is a technique used in a location that people pass through, such as a passageway, in order to measure how many people pass through it. This has already been partially implemented as a technique for measuring the transient audience from an image. In a typical setup of the current method, the camera is attached to a high point such as the ceiling; it captures images taken in the downward direction, and the technique determines the transient audience number by image analysis. Although one of the features of the conventional method is that it enables accurate measurement, it is only applicable to a limited area because measurement is possible only under the camera or nearby, which makes it difficult to measure the transient audience in an entire passageway or station concourse, for example. To measure within a wider range, it is necessary to install a camera that points obliquely downward and use images captured within a wide range. A previous technique that can be applied in such a case is called tracking. This detects each person individually from an image and traces that person’s movement path. Various improvements have already been made to the tracking technique, but the occlusion problem (people overlapping or being hidden in the images) inevitably makes it difficult to perform stable measurements in places such as station passageways, and the processing results can drop greatly for a crowd. To exceed the limitations of the existing techniques, NTT has developed a transient audience measurement technique that uses an approach that is completely different from previous ones. It calculates the final transient audience by combining two techniques: a fluid analysis technique that is applied for crowded conditions and a one-dimensional tracking technique aimed at greater measurement accuracy in uncrowded condition. 2.2.1 Fluid analysis technique (measurement algorithm applied to crowds)The fluid analysis technique can estimate the transient audience by treating the overall flow of people as if it were the flow of a fluid. The basic concept is shown in Fig. 3, where to simplify the explanation, we show the view directly downward whereas in practice the processing is done on images captured by a camera pointing obliquely downward. In general, the flow rate of a liquid or gas in a pipe can be calculated as the product of the pipe’s cross-sectional area, the fluid’s speed, and the fluid’s density; however, this concept can also be applied to a flow of people. In other words, when the processing area is set on an image or on the floor, we can calculate the transient audience (flow rate) at a later stage if we have (1) the density (number of people within the area) and (2) the movement speed of people. We can calculate the number of people within the area (1) by using the crowd measurement technique described above and we can calculate their speed (2) by taking several consecutive images in a time series and detecting corresponding pairs of feature points and considering the similarity of their feature vectors. Note that since perfect correspondence is rare, we chose to use an algorithm that determines speed through a voting mechanism, which can avoid the influence of feature point miscorrespondence. Note also that the description relates to one-way flow, for simplicity, but in practice it is also applicable to flows in both directions in passageways. This technique enables us to calculate the transient audience in a stable manner, even in locations such as a crowded station concourse, specifically in a state where there are several dozen people, e.g., 50 or 100, in front of the screen.
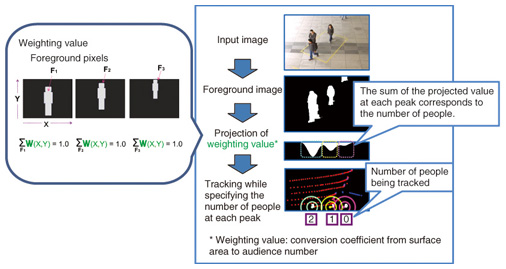
2.2.2 One-dimensional tracking technique (measurement algorithm during quiet times)The fluid analysis technique described above has the great advantage that it enables stable measurement even when the area is crowded, but it does have the disadvantage that the accuracy is insufficient during quiet times when the number of people is between one and five. To overcome that disadvantage, we have developed a one-dimensional tracking technique that can measure highly accurately during quiet times and also enables rapid processing (Fig. 4). It detects the image area to which a moving object belongs, forms an input image series, and projects that area in a one-dimensional version in accordance with a conversion coefficient called a weighting value. The theoretical background of the weighting value is given in Ref. [3]. The results of this processing are such that a peak in the projected values corresponds to the position of a person, and the sum of projected values in the vicinity of that peak corresponds to the number of people in that vicinity (the number of people contributing to that peak). We can measure the transient audience for each direction of movement by estimating the person-number at each peak in the projected values and simultaneously following their positions.
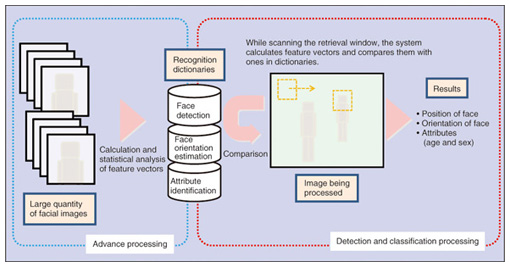
Note that the final transient audience is computed by creating a weighted average of the numbers obtained by fluid analysis and one-dimensional tracking. The weight is adjusted to suit the congestion level, which is estimated by the crowd measurement technique described in section 2.1. 2.3 Face detection, orientation estimation, and attribute classification techniqueThe face detection, orientation estimation, and attribute classification technique developed at NTT picks out faces within images, estimates the orientation of each detected face, and estimates the attributes (sex and age) of that person. These three processes share the same fundamentals in common: each process pre-analyzes a large quantity of image data gathered beforehand and utilizes that analysis in making its decisions (Fig. 5).
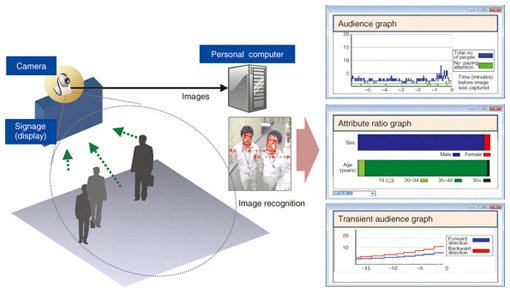
Examples of attribute classification are given below. First of all, a large volume of image data of the faces of people of both sexes and various different ages, captured from various different angles, is gathered beforehand. A feature vector, which is the digitization of the features of the entire face, is calculated for each facial image. Then, for each age and sex group, the technique analyzes what kind of distribution the feature vectors have. The analysis results are called a recognition dictionary. During the actual processing, the system decides which age and sex group the face belongs to by calculating the feature vectors for the entire face in a manner similar to the recognition dictionary creation process, for the face area within the image detected by the face detection processing, and by comparing them with those in the recognition dictionary. 3. Advertising effectiveness measurement system V3Our advertising effectiveness measurement system V3 combines the above-described crowd measurement technique; transient audience measurement technique; and face detection, orientation estimation, and attribute classification technique. It can measure the advertising effectiveness index of digital signage. An overview is shown in Fig. 6. The abovementioned image processing is done while camera images are being imported to a personal computer, and the results are output as log data in real time. The system can use either one or two cameras and perform processing in one of the following two formats: (1) all of the image processing is done by one camera or (2) face detection, orientation estimation, and attribute classification are done by the camera close to the signage while the crowd measurement and transient audience measurement are done by the second camera, which captures a wider range. The attribute classification results are output in accordance with marketing segments which denote females between the ages of 20 and 34 as F1 and males between the ages of 35 and 49 as M2.
4. ConclusionThis article introduced image processing techniques for measuring the advertising effectiveness of digital signage and the measurement system V3. We will proceed with implementing these techniques as methods of measuring digital signage advertising effectiveness. In addition, since these techniques could be applied to fields other than digital signage, such as marketing information acquisition and safety management support in locations where large numbers of people gather, such as stations and various event facilities, we would like to proceed with not only the advertising effectiveness of digital signage but also validation of its applicability to fields such as safety management support in various locations. References
|
||||||||