|
|||||||||||
|
|
|||||||||||
       |
Feature Articles: Activities Toward Service Incubation to Speed Up R&D of Service Systems Vol. 11, No. 9, pp. 5–10, Sept. 2013. https://doi.org/10.53829/ntr201309fa1 Service Visualization to Achieve Faster Service CreationAbstractAs part of efforts to improve our research and development (R&D) activities, we need to speed up our service-related R&D. These Feature Articles introduce various approaches for this, from visualizing services to conducting trials on XFARM (R&D cloud environment) that NTT Service Evolution Laboratories is working on.
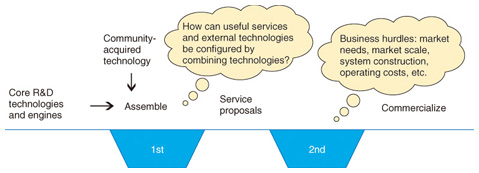
1. IntroductionThe gap that exists between research laboratories and business operations has long been known as the valley of death. This valley represents the many obstacles that must be overcome before research achievements can be commercialized. These obstacles include cost considerations, product development, and market expansion hurdles. Research achievements that fail to make it through this valley fall into disuse and oblivion. With regard to services, as opposed to component technologies and network node technologies, there are thought to be two such valleys (Fig. 1). The first valley relates to how technologies can be combined into useful services. Even a good technology will fail to make it into the world unless it can be incorporated into services that appeal to users. The second valley relates to whether services created in this way can actually flourish. This consists of hurdles from a business viewpoint such as demand, market scale, pricing, and the costs of systems and their operation.
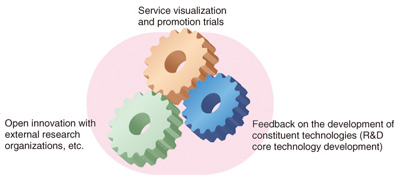
NTT’s laboratories have made advances in technologies that are associated with many services, for example, voice recognition, video codecs, language processing, audio technology, recommendation systems, and life logging. However, we have tended to concentrate our efforts on the research and development (R&D) of individual technologies, and no department has had overall control of service proposals. Therefore, in line with recent trends towards strengthening service systems, we have held discussions on how the R&D of services should be promoted. The keywords that cropped up in these discussions are service visualization and open innovation, which are intended to produce feedback on the development of core technologies (Fig. 2).
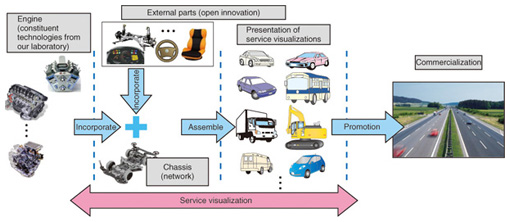
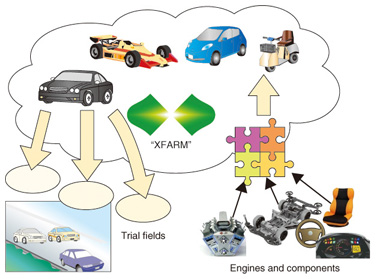
Service visualization is an activity to develop service prototypes that incorporates R&D technologies based on certain concepts. Although research achievements have been widely exhibited in the past, service visualization represents a transition towards presenting the feasibility of new technologies in the form of services, instead of simply demonstrating these technologies in isolation. Open innovation is an activity that builds services by actively incorporating technologies from a wide range of external sources such as other research organizations and commercial products. One aspect of services is that they are assembled from multiple technologies. This assembly can be difficult to achieve only by using technologies developed in a laboratory, so the scope of proposals includes not only a pick and mix range of services based on individual technologies, but also a menu of services with added value that provide a balanced combination of multiple ingredients (technologies). Feedback on the development of core technologies is provided with the aim of giving the technical R&D departments prompt feedback on external opinions and the findings of service visualization and open innovation efforts. The three initiatives mentioned above should make it possible for services to traverse the first of the valleys of death mentioned at the beginning of the article. In line with the objectives discussed above, a Service Incubation Project (SIPT) has been promoted since August 2011 with the aim of advocating the integrated management of service-related R&D projects, as shown in Fig. 2, chiefly within the NTT Service Innovation Laboratory Group. A task force whose remit includes this service visualization was set up and put into operation at NTT Service Evolution Laboratories. 2. Service visualizationAs mentioned above, since services have an assembled aspect whereby they can deliver the collective strengths of multiple technologies, they cannot be implemented if they are created exclusively from technologies developed in a laboratory with a not invented here attitude. The concept of service visualization by analogy with the development of an automobile through the production of prototype vehicles is shown in Fig. 3.
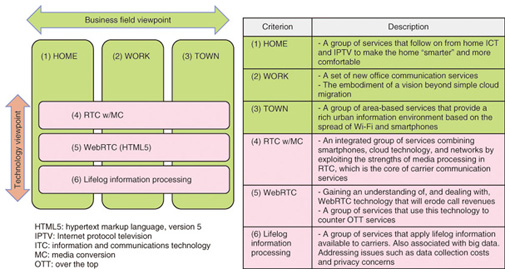
The basic idea is that it is possible to develop a versatile range of cars that use the same engine. Even if the cars use engines produced by another company, the aim is to produce prototype cars with a high degree of utility that people will want to own. In addition, there are also the following separate policies: (a) Develop cars with character (inspired by usability, consistent service concepts). (b) Acquire a good engine and carefully selected parts (open innovation incorporating new technologies and understanding existing technologies). (c) Regard the chassis as a network (geared towards carrier services). (d) Consider whether other vehicles could be made by using the same method (architecture/platform-oriented). (e) Build lots of prototype cars (and carry a percentage of these through to actual production). If service visualization is carried out by recklessly introducing services and applied technologies, it will not conform to the above policies. We have therefore established the following framework for proceeding with service visualization. (1) Portfolio of work fields The users targeted by services cover a diverse range and include home and business users. There is also a certain degree of directionality in the key technologies applied to these services. A general representation of the types of services applied in different fields is shown in a portfolio of work fields (Fig. 4). The directionality of each field is established by representing business fields along the horizontal axis and technologies on the vertical axis. In this way, we can clarify the service visualization target and check the adequacy of all areas. This portfolio is subject to review at suitable intervals, especially with regard to the technical fields.
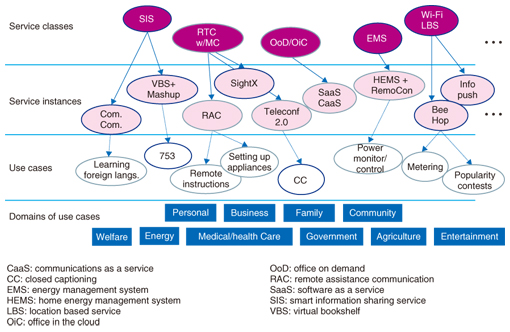
(2) Service model Service ideas are created through brainstorming with the assumption of certain use cases in order to come up with general-purpose services that can be applied to multiple use cases. For example, if we assume that we are working on a speech-to-text conversion service for real-time communication (RTC) [1], then we can consider augmenting or modifying this service to make it useful for other forms of RTC media. In other words, as a higher-level concept of a service under consideration, we can envisage a set of services that augment and modify media in RTC. This is just like the class-instance relationship in the object-oriented programming paradigm, so in this model they are respectively called service classes and service instances. Service visualization takes place at the service instance level, and discussions of architecture take place at the service class level; this resembles the characteristics and processing patterns of service processing. In this way, we can go about system visualization in a systematic way (Fig. 5).
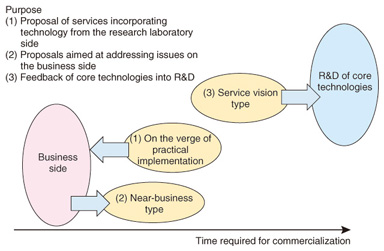
(3) The purpose of service visualization When service visualization from the research laboratory side was shown to people on the business side, it received comments such as “Interesting, but it doesn’t solve the issues we are currently facing”. Therefore, we decided to classify the visualization of services in terms of their main purpose. If we take as a starting point the business-side issue of visualizing a service that is on the verge of being practically implemented and that can be implemented using current technology as proposed by the research laboratory, we perform a near-business type service visualization based on the solution proposed by the research laboratories. A service vision type visualization is also performed in order to visualize the image of a service that is difficult to perform at the current level of technology, and to facilitate discussions on the directionality of the R&D of core technologies (Fig. 6).
We developed a specific system for service visualization by setting up an in-house production unit for service visualization in the research laboratories. We started this system with the target of carrying out at least one service visualization per month. Some work has been done that facilitates this process. For example, a library of systems and previously visualized service functions has been created. As a result, we can now achieve a speed of one service visualization every one or two weeks. At the NTT R&D forum and other events that followed the launch of this system, we gave at least five demonstrations of service visualization on each occasion. In this feature article, we introduce the main service visualizations that we have so far performed, except for visualizations such as near-business type services and services that are currently undergoing trials, which we are unable to disclose. 3. XFARMRecently, the concept of lean start-up*1 has gained recognition. Since service visualization is only used for prototypes, these prototypes cannot actually be used by their intended users even if they include the service images or technical proposals. After service incubation measures have been taken with the aim of speeding up service-related R&D, a service still has to negotiate the sea of Darwin*2, where it is subject to a form of natural selection before it can really be accepted by users. Therefore, the next issue to be tackled after service visualization is the construction of a cloud-based service trial farm environment for operational research at the NTT Software Innovation Center, where services of sufficient quality for end-user interaction can be uploaded and tried out [2]. We call this environment “XFARM” (Fig. 7).
The XFARM environment has the following two purposes: (a) By implementing services on the cloud from where they can be delivered via networks, we aim to speed up the provision and launch of trial services. This provides a source of feedback on the proposed services and constituent technologies. (b) By setting up various engines and component groups in the cloud and sharing them between multiple visualization projects, we aim to achieve visualizations more quickly and at lower cost.
4. Future prospectsAbout a year and a half has passed since we started the initiatives discussed in this article. In the future, we will continue to strengthen the activities discussed here throughout the R&D of services while collaborating with the various departments of related businesses and producers. Furthermore, in terms of how to go about researching and developing services in the era of Next Value Partner (NTT slogan) and clients, we will focus on taking quick action that is responsive to changes in the outside environment. References
|
||||||||||