|
|||||||||||||
|
|
|||||||||||||
       |
Feature Articles: Applications of Big Data Analytics Technologies for Traffic and Network Management Data Vol. 11, No. 11, pp. 18–22, Nov. 2013. https://doi.org/10.53829/ntr201311fa2 Analyzing Internet Traffic Structure through Big Data TechnologyAbstractThe volume of Internet traffic consisting of content delivered by large content providers continues to increase. Moreover, the traffic control measures used by those content providers make the dynamics of Internet traffic more complex. In this article, we introduce a method of analyzing the complex dynamics of Internet traffic and present some results obtained after applying the method. Keywords: Internet, content delivery, traffic
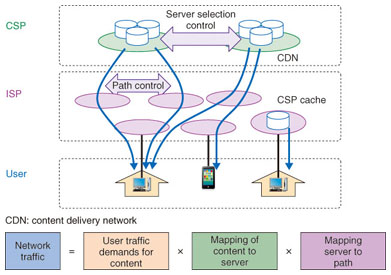
1. IntroductionThe volume of Internet traffic has long been increasing exponentially. It was reported recently that not only is the volume increasing, but the composition is also drastically changing. The major portion of traffic is changing from P2P (peer-to-peer) file sharing to video content delivery from large content service providers (CSPs) [1]. This has led to a change in the structure of traffic exchanges among autonomous systems (ASes), specifically, between CSPs and Internet service providers (ISPs) [2]. Those CSPs are deploying their cache servers inside the ISP networks or establishing direct peering to ISPs to reduce the response time for content retrieval as well as the transit cost if they are otherwise required to pay a fee to the transit providers. In addition to the changing trend in the structure of Internet traffic delivery, these CSPs change the allocations of their content servers for users' content requests. This leads to short-term traffic fluctuations in the ISP networks. These traffic fluctuations and the changing trend in traffic delivery bring new challenges in bandwidth provisioning and traffic management for ISPs. Long-term changes in the content delivery structure lead to changes in peering strategy, and short-term fluctuations make it difficult to predict and manage traffic. We describe here how to measure and analyze these changes and fluctuations in the Internet traffic delivery structure. Specifically, we decompose traffic delivery into users' traffic demands, CSPs' content supply, and ISPs' content delivery. By decomposing the traffic delivery structure into these three components, we can identify the changes in the structure and the root causes for the changes, making it possible to predict such changes and develop countermeasures. 2. Traffic decomposition and measurementThe decomposition of network traffic into traffic demands of users, content supply by CSPs, and traffic distribution by ISPs is shown in Fig. 1. User demands are mapped to network traffic by control techniques applied by both CSPs and ISPs.
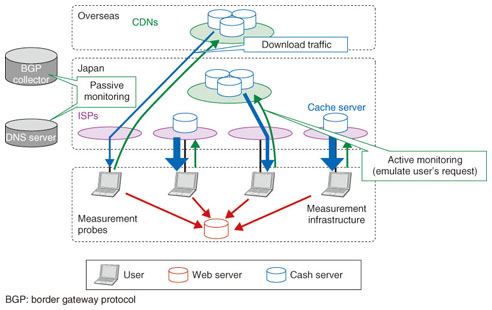
2.1 User traffic demandsContent delivery traffic originates with the users' traffic demands. Here, traffic demands indicate users' requests for content, for example, video, to CSPs. Those demands are calculated by monitoring users' access logs that are captured by network monitoring agents [3]. 2.2 CSP content supplyCSPs dynamically allocate a content distribution server for each user content request in order to optimize load balancing and the quality of content delivery. Normally, the nearest server to the user is allocated, but in some cases, other servers may be allocated based on the status of server load, network congestion, or server failures. These changes in allocation cause short-term fluctuations in network traffic. Server allocation methods are roughly divided into two categories: DNS (domain name system) based methods and web server based methods (Fig. 2). In the former, a content distribution server is assigned to a user request as an Internet protocol (IP) address in a DNS response for the query from the user. In this allocation, the DNS response IP address is determined based on the source IP address of the DNS query, which is normally not the user's IP address but a DNS cache server's IP address. By contrast, in the latter type, when a user accesses a web server to view content, the server dynamically allocates a server for the content request and returns an HTML (hypertext markup language) page with a URI (uniform resource identifier) that includes the server.
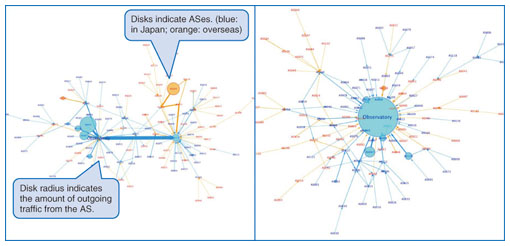
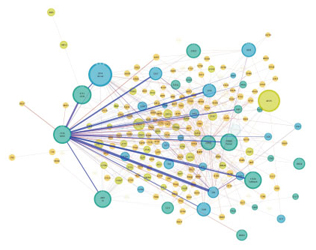
These allocations can be measured by using passive or active monitoring techniques, specifically, by passively monitoring the network traffic or by actively accessing the content. By monitoring DNS traffic, we can observe how a user's request for content is mapped to an IP address of the server. This passive monitoring is advantageous in that it allows all user requests to be monitored inside the monitored network. The advantage of the latter monitoring technique is that it can monitor the mapping of multiple networks by sending emulated user requests from outside the network. 2.3 ISP traffic deliveryOnce the server for the content request is determined, then the path between the user and the server is determined by ISP routing control. Normally, this control is not limited to a single ISP, but spans multiple ISPs because CSPs, which have content, and ISPs, which have users, are different autonomous systems (ASes). ASes control the routing to optimize the quality of content delivery and also to minimize the transit costs that depend on the relationship between ASes. Monitoring of the routing controls is also measured by passively monitoring routing control messages such as BGP (Border Gateway Protocol) messages [4], or by actively sending probe packets for routing using a tool such as traceroute. The advantages of both types of monitoring are the same as for the server allocation, in that the former type can monitor all traffic inside the network, whereas the latter can monitor the statuses of multiple networks. Inferring traffic exchanges in a network from outside the network is said to be difficult [5], but by decomposing the user requests, server selection, and routing control, we can infer traffic exchanges from outside the network, as described in the next section. If we can assume that the popularity of the content that users request is roughly the same among the ISPs, then we can infer the network traffic exchanges by monitoring the server selection and routing control from outside the network. 3. Measurement resultsWe applied the active access measurement method explained in the previous section to analyze traffic. Examples of visualizing HTTP (hypertext transfer protocol) download traffic for two networks using this method are shown in Fig. 3. Each node represents an AS, and the edge between two nodes represents the traffic exchange between the ASes. The disks indicate larger nodes; the radius of the disk indicates the volume of traffic from that AS. In these visualizations, users' traffic demands are assumed to be the same for the two networks, but because the server selections and routing controls are different, the resulting traffic structures are significantly different. Specifically, we confirmed that the network on the right has a content cache server of CSPs inside the network and that the server is allocated for almost all user content requests; thus, the traffic for the content requests flows inside the AS. This observation corresponds to a recent report on the trend of Internet traffic structure changes [1].
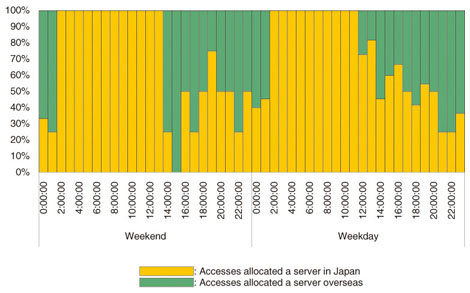
In addition to the change in the structure of traffic, we also observed short-term fluctuations in CSP server allocation. The results of observing traffic from three measurement points in Japan are shown in Fig. 4. The orange bars indicate the ratio of accesses that were allocated a server in Japan, and the green bars indicate the accesses allocated servers from overseas. These changes affect the bandwidth provisioning of links connected to other ASes.
4. ConclusionWe, as an NTT Communications advanced IP architecture center, are now developing an infrastructure for network data measurement, analysis, and visualization that is based on the Internet traffic structure analysis method described in this article. The measurement infrastructure is built on a network that has BGP transit connections with multiple ISPs. We are also developing a visualization tool that shows the inter-AS connection status, as shown in Fig. 5.
References
|
||||||||||||