 |
|||||||||
|
|
|||||||||
|
Feature Articles: Applications of Big Data Analytics Technologies for Traffic and Network Management Data Vol. 11, No. 11, pp. 29–34, Nov. 2013. https://doi.org/10.53829/ntr201311fa4 Network Failure Detection and Diagnosis by Analyzing Syslog and SNS Data: Applying Big Data Analysis to Network OperationsAbstractWe introduce two big data analysis methods for diagnosing the causes of network failures and for detecting network failures early. Syslogs contain log data generated by the system. We analyzed syslogs and succeeded in detecting the cause of a network failure by automatically learning over 100 million logs without needing any previous knowledge of log data. Analysis of the data of a social networking service (namely, Twitter) enabled us to detect possible network failures by extracting network-failure related tweets, which account for less than 1% of all tweets, in real time and with high accuracy. Keywords: big data, syslog, network failure detection 1. IntroductionInternet protocol (IP) networks consist of many kinds of equipment from different vendors. These networks are becoming much more complex because of the increasing demand for new and different applications. Additionally, many of these applications are provided by multiple network operators and devices, and this makes it very difficult to diagnose network failures when they occur. Consequently, it is very important to develop methods to efficiently detect network failures and diagnose their causes. In this article, we introduce two methods for analyzing data from syslogs and from a social networking service (SNS) to achieve early network failure detection and to diagnose the cause of the network failure that current operating methods cannot address. 2. Log data analysisNetwork operators monitor various kinds of information such as trap information from network elements, network traffic, CPU (central processing unit)/memory utility data, and syslog data. In particular, the syslog data of network elements such as routers, switches, and RADIUS (Remote Access Dial In User Service) servers include detailed and precise information for troubleshooting and monitoring the health of networks when configurations change. However, analyzing log data has become very difficult for the following reasons: (i) There are various types of logs, which list messages with low or high severity. In addition, the increase in the number of network elements means there is a massive volume of complex log data, and it is therefore necessary to extract information accurately and efficiently in order to carry out troubleshooting and preventive maintenance. (ii) The log format depends on each vendor or service. Thus, understanding the meaning of each log message requires deep domain knowledge of each format. To overcome these problems, we have developed a technique to analyze syslogs that involves automatically extracting the relationships or abnormalities from log messages using machine-learning methods without relying on any domain knowledge about the format or the vendor of log data (Fig. 1). This analysis technique consists of four steps: log template extraction, log feature extraction, log grouping, and visualization of abnormal events.
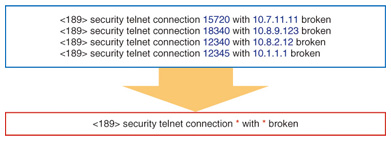
2.1 Log template extractionLog messages contain various parameters such as IP address, host name, and PID (process identification). Because parameter words are very rare, log messages with unique parameters may never appear twice even though the events the messages signify are the same. Therefore, we automatically extract a primary template from all log messages based on the observation that parameter words appear infrequently in comparison with template words in the other positions (Fig. 2). The log template enables us to easily correlate log messages.
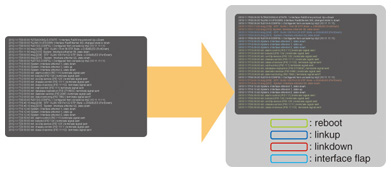
2.2 Feature extractionAs mentioned before, the vendor’s severity of a log message is not necessarily reliable because it is not directly related to the actual network abnormality. Therefore, we need to quantify the abnormality and normality of logs without considering the severity of the message and without requiring any domain knowledge. For example, firewall logs and link down/up logs related to users’ connect/disconnect events contain very common messages and can be considered. Also, the logs generated by cron* jobs or in regular monitoring are not as frequent but are generated periodically on a daily basis. Therefore we define the frequency and periodicity features for log messages. 2.3 Log groupingTypically, network operators do not use a one-line log message, but rather, a group of logs. For example, a router reboot event induces multiple logs, which indicates that various processes start at the same time. Thus, we need to group them in terms of their co-occurrence. Grouping logs reduces the volume of logs and helps operators make sense of the logs. For log grouping, we use the machine learning technique known as non-negative matrix factorization (NMF) by converting input log data into a matrix (Fig. 3).
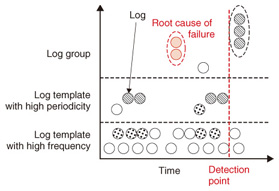
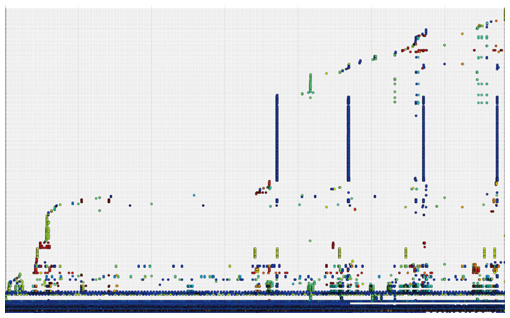
2.4 VisualizationIn this step of the analysis, log data are expressed as a graph. A conceptual image of log visualization is shown in Fig. 4, and an example of a log graph is shown in Fig. 5. In both figures, the horizontal axis represents time, and the vertical axis represents the template or log groups mentioned earlier. Each point in the graph represents the occurrence of each log template or log group at each time. Hosts are distinguished by their different colors and patterns in this example. The order of log templates or log groups on the vertical axis is determined according to frequency and periodicity. That is, the log template with high frequency is set at the bottom of the vertical axis; above that is the log template with high periodicity. The template groups are positioned above them. They are sorted by log group frequency and then sorted based on their first appearance. By differentiating log messages with high frequency or periodicity, we can distinguish the log groups that occur independently of time. This makes it possible to visualize millions of log messages in a single screen and to easily understand in a visual way when the log messages occurred and what kinds of log messages appeared. Further, sorting by frequency and periodicity makes it easier to find unusual types of log messages, and grouping log messages helps associate unstructured log messages with real events that occurred in the network.
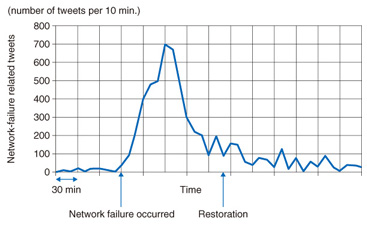
3. Twitter analysisNetwork operators can monitor network equipment by using monitoring technology such as SNMP (simple network management protocol). Although they can detect hardware failures, it is difficult for network operators to detect failures caused by software bugs or to detect quality deterioration due to congestion. Consequently, some cases become silent failures, which cannot be detected by network operators. We have studied a way to monitor a social networking service (SNS), namely, Twitter [2], to discover problems affecting subscribers. For example, we can see a surge in tweets about network failures when a network failure occurs, as shown in Fig. 6. We developed a system to monitor Twitter in real-time by checking for surges in these kinds of tweets.
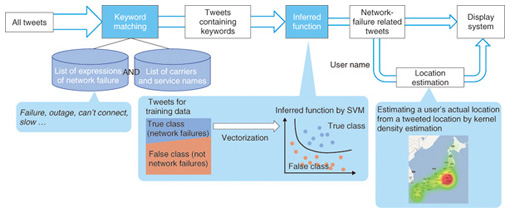
3.1 System requirementsTwitter is a popular platform for discussing countless conversation topics, and the number of tweets now exceeds 400 million per day [3]. Japanese tweets alone account for 80–100 million tweets per day. Since the number of tweets that relate to network problems is very small in the total number of tweets, we need a way to extract only relevant tweets (first requirement). In addition, to detect the area where a network failure occurs, we need a way to determine the location of the tweeters (second requirement). 3.2 Method to extract only network-failure related tweetsWe found in our investigation that keyword matching, a traditional way to search tweets, was not sufficient for automated monitoring because it resulted in many false positives. This occurs when the tweets contained the keywords, but the tweets were not related to problems with the network. For example, if we search using the keywords call and drop, we may get tweets such as: “I dropped my phone in the toilet so I can’t call or text”. Because keywords such as call and drop are not network-specific words, keyword matching may lead to a lot of false positive tweets that contain the keywords but not the topic of the network problem. The network failure detection architecture is shown in Fig. 7. We use supervised learning, namely, SVM (support vector machine), to suppress the false positives. Supervised learning uses a data set of training examples. Each training example consists of a pair of the text of a tweet and a label indicating whether the tweet is related to a network failure. A supervised learning algorithm analyzes the training data and produces an inferred function to divide tweets into those that are related to network failures and those that are not. In our approach, each tweet is translated into a vector by using the bag-of-words method, which is a traditional method in document classification. This method can be expected to suppress the false positives by statistically considering all words appearing in one tweet.
We evaluated the effectiveness of our method by applying it to an entire year’s worth of Twitter data. Six network failures were reported by a network carrier in that period. We evaluated the network failure detection system by counting the number of tweets that were classified by our method. When the count exceeded a certain threshold, we considered it to be an alert of a network failure. We also used the keyword-matching method for comparison. Both methods detected the 6 actual network failures. However, the keyword-only method also falsely detected 94 events, whereas the machine-learning method suppressed almost all of those and had only 6 false detections. 3.3 Method to determine the location of tweetersTwitter has a function to attach the user’s location by GPS (Global Positioning System) data, but most users choose not to opt into this function. Therefore, we need to estimate the location of Twitter users who wrote the network-failure-related tweets. Some studies have used the bias of a distribution of words, which mainly involves dialect characteristics, to estimate a user’s location. However, these studies estimate a rough granularity of areas such as the Kanto region with an error of about 150 km and do not meet our requirement, which is to achieve at least prefecture-level location (an error of less than 50 km). Therefore, we studied a high-accuracy location estimation method that uses gazetteer information, which includes the pairs of a geographic name and its coordinates. While most tweets do not contain GPS information, many tweets contain a geographic name. Although users may tweet the geographic names of places other than where they are actually located, the overlapped locations of many of their tweets will make it possible to estimate their location because Twitter is a service for users to post what they are doing. We used the kernel density estimation method to overlap the tweets of individual tweeters. We evaluated the estimation error of users whose locations were known and found that the estimation error was less than 50 km for two-thirds of those users. Furthermore, the estimation error was less than 25 km for half of all users, which demonstrated that our method was effective. 4. ConclusionWe introduced a big-data approach consisting of syslog and SNS analysis to predict or detect network failures. In cooperation with group companies, we are now evaluating the efficiency of syslog analysis using actual syslog data. We are also preparing a proposal for group companies for the use of SNS analysis as a tool for detecting silent failures. References
|
|||||||||


