|
|||||||||
|
|
|||||||||
       |
Feature Articles: Applications of Big Data Analytics Technologies for Traffic and Network Management Data Vol. 11, No. 11, pp. 35–38, Nov. 2013. https://doi.org/10.53829/ntr201311fa5 Analyzing Macroscopic Demand Structure Based on New Model of S-shaped GrowthAbstractWe tackle the issue of quantitatively evaluating the impact competitors have on a market. In this article, we introduce a method for estimating this impact based on a new theory of S-shaped growth in innovation diffusion. Keywords: S-shaped growth, structural change, innovation diffusion
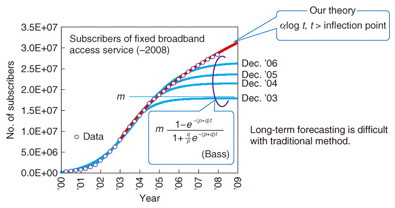
1. IntroductionIt is important for network planners to forecast the demand for network traffic at high resolution. Whereas short-term forecasting, for example, within a one-year range, may be possible by extrapolating it linearly from past demands, medium- and long-term forecasting is much more difficult. The growth curves of the number of people using a new service are often S-shaped. That is, growth is small when the service is first introduced; it increases soon after at an accelerated pace, and then slows down in the final stage as the service becomes more widespread. The S-shaped growth curve is often observed with new services, products, methods, or ideas. However, the structure of the S curve has not been revealed despite the large number of studies that have been done on it. Studies on the diffusion of innovations, a concept that involves how, why, and at what rate new ideas and technology spread through cultures, began in the 19th century. Empirical studies [1] have revealed important facts including that the population ratio of earlier adopters of an innovation is small and that they tend to communicate about the innovation with people beyond their local communities, whereas later adopters tend to communicate about the innovation inside their local communities. However, even the basic question of why growth curves are often S-shaped had not been answered. Most of the proposed models to explain or capture the S shapes were given by mathematically explicit formulas with few parameters. Many studies examined these models with diffusion data and showed fairly small errors of fitting with the data. However, it has been revealed that these models have rarely succeeded when they are applied to forecasting the growth over a long term. We show how such forecasting fails by extrapolating a traditional model, namely the Bass model [2], in Fig. 1. The graph in this figure shows the subscribers of a fixed broadband access service. The blue lines are forecasting results obtained by extrapolation using the Bass model with different times of starting the forecasting. The results vary greatly when the time to start the extrapolation is changed, and all of the results of long-term forecasting eventually fail. In contrast, the results achieved using our method (red line) fit the actual numbers quite well.
NTT Network Technology Laboratories has been investigating this issue, and we recently proposed a new theory [3] that explains the S-shaped growth. Our new theory offers at least two findings regarding forecasting. First, the final adopter population cannot be estimated by extrapolation of growth curves. Second, stable long-term forecasting is possible until the demand for something reaches the final stage. In this article, we give an overview of our new theory and describe how it can be applied to analyze the demand for broadband service in the Japanese market. 2. New theory of S-shaped growthThe key to our new theory follows the basic hypothesis: the heterogeneity of adopters follows power laws. The hypothesis regarding the heterogeneity of adopters has been proposed in previous studies [1]. Although the researchers in those studies assumed mathematically tractable distributions of heterogeneity such as normal distributions, our hypothesis adopts a pair of power distributions. This pair of power distributions has been widely observed; e.g., the distribution of income and that of the frequencies of using content. These distributions have discontinuities that consist of a boundary point between the domains of two power distributions and the upper and lower cut-offs of the distributions. These two power distributions indicate that a society can be seen as consisting of a strong minority and a normal majority when we evaluate individual performance using a certain measure. We can derive a structure of S growth on three levels: the structure of individual adoptions of an innovation, the social structure of the flows of information about the innovation, and the S shape of a growth curve. The social regularities (power laws) are represented as the characteristics of the flows of innovation information. Our new theory clarifies the macro-micro relationship between the structure of individual adoptions of innovations and the S shape of a growth curve, which will provide a new basis for understanding the diffusion of an innovation. We can describe the net increase in the demand for a certain service by using two different power-law distributions, which transit at an inflection point on the S growth curve, as shown in Fig. 2. An inflection point is a point that represents the maximum value of a net increase.
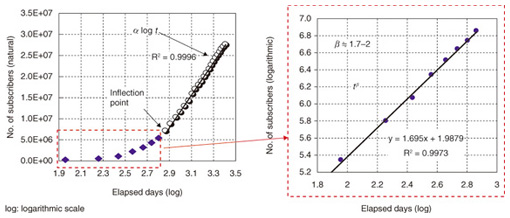
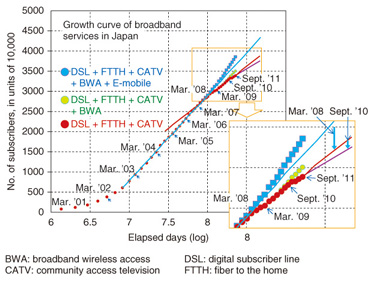
The forecasting model for the days after the inflection point can be formulated as y(t) = αlog(t)+y0, where t represents the days that have elapsed since the first day of an innovation diffusion, y(t) is the total demand at t, α and y0 are constants, and the base of the logarithm is natural. This formula stably extrapolates the number of subscribers of broadband and mobile phone services. 3. Analysis of demand for a broadband serviceOur new theory enables us to forecast the number of subscribers of a broadband service if the market structure does not change. Conversely, a large error between the forecast and the actual values means that a change in the market structure occurred. The number of subscribers of a fixed broadband service is plotted in Fig. 3 as a red dotted line. Since the growth curve can be described by y(t) = αlog(t)+y0 after the inflection point, the number of subscribers grows linearly on the logarithmic x-axis. The number of subscribers grew along the line, and then the red line changed its gradient twice, which means market changes occurred. We infer that these changes in the market situation were due to mobile broadband services that started diffusing at those times.
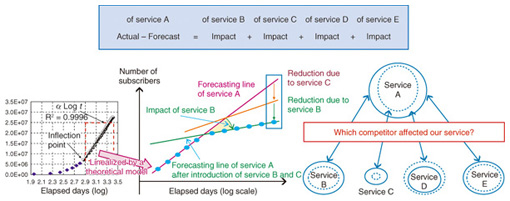
We can quantitatively analyze the change in the market as seen in the graph, which will enable us to develop an effective strategy and to allocate costs appropriately. We can identify the change by inspecting the red dotted line showing the number of subscribers on a logarithmic axis (Fig. 4). We found that while the curve representing a nationwide scale described only high-impact changes, the curve representing the prefecture scale showed differences in the competition circumstances of each prefecture.
4. Conclusion and future workWe expect our method to be utilized for planning network and service strategies effectively and in a timely manner considering that the competition in the Japanese broadband market is intensifying for both fixed and mobile services. Our goal is to model the market behavior in order to predict the efficiency of supply-side actions. As the first step, we are planning to analyze the market on a more granular level to learn more about the behavior of individual consumers. References
|
||||||||