|
|||||||||||
|
|
|||||||||||
       |
Feature Articles: R&D Efforts at NTT FACILITIES Vol. 12, No. 11, pp. 89–96, Nov. 2014. https://doi.org/10.53829/ntr201411fa14 Application Technology for Buildings and Facilities DataAbstractNTT FACILITIES has accumulated a massive amount of data through the longstanding implementation of planning, designing, construction, and maintenance management services for telecommunications power systems, air conditioning systems, and buildings. In recent years, we have been developing technologies for applying this data to establish faster and more efficient ways of responding to malfunctions, deterioration, and fault prediction of buildings and facilities. In this article, we describe how we intend to use this collection of data on buildings and facilities to strengthen our services. Keywords: power supply system, buildings and facilities, big data
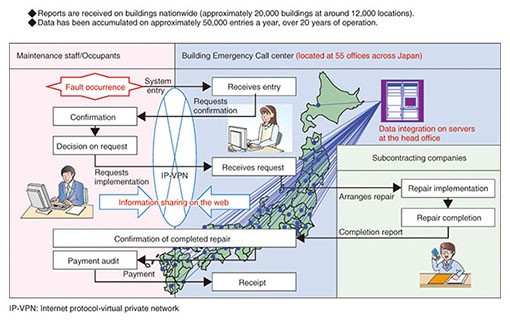
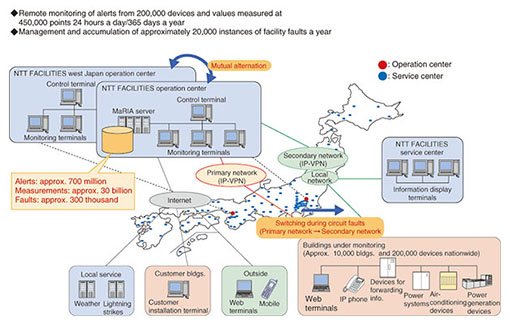
1. IntroductionIn maintaining the information and communication technology (ICT) infrastructure, NTT FACILITIES strives to fulfill the critical mission to “Never let telecommunications be interrupted” to our customers as well as NTT Group companies. This maintenance process involves managing approximately 20,000 telecommunications and office buildings at around 12,000 locations all over Japan (as of March 2014), and conducting monitoring and maintenance of telecommunications power systems and air conditioning systems amounting to approximately 200,000 devices. To accomplish these tasks smoothly and reliably, we have been developing and operating maintenance support and remote monitoring systems such as the Building Emergency Call service and an integrated maintenance system for facility operation. These systems are helping to improve the reliability of ICT services by making it possible to quickly implement the appropriate maintenance services (Fig. 1).
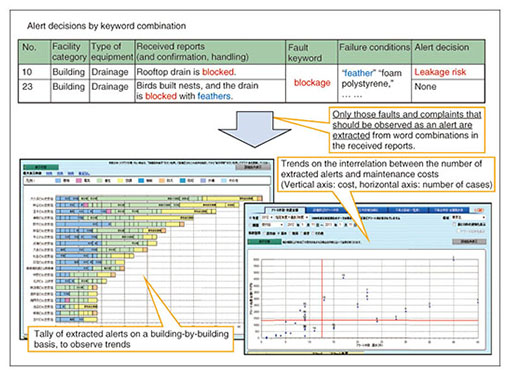
NTT FACILITIES has been accumulating a massive amount of data on buildings and facilities over the years via these maintenance and monitoring systems and has been utilizing the data for various building maintenance and facility management services. In recent years, big data technology has been attracting a lot of attention, and this technology is making it possible to take advantage of the vast amount of varied information that was once difficult to deal with. Currently, NTT FACILITIES is also working on ways to generate new added value by taking advantage of the accumulated data. As part of these efforts, we would like to introduce our new approaches to applying the accumulated data in building maintenance management and power supply systems for telecommunications. These approaches will be useful for monitoring and maintaining buildings and facilities nationwide. 2. Application of building maintenance management data2.1 Versatility and potential of building management dataIn addition to the vast amount of data that has been acquired, building data also includes a wide variety of figures and photographs. Because of this, while optimization of individual items on a task-by-task basis has been achieved, overall optimization in terms of ensuring the soundness of telecommunications buildings has not yet been realized. Applying big data related technologies to the area of building maintenance management allows us to find tendencies in deterioration and the occurrence of faults that were previously unknown. To this end, we are working on achieving lower cost and higher precision in predicting deterioration and in planning, and also in realizing the overall optimization of corporate real estate (CRE*1) for the future. 2.2 Application of fault and complaint recordsNTT FACILITIES receives fault and complaint reports from associated facilities all over Japan, and we operate the Building Emergency Call service to assist in dealing with them (Fig. 1). This emergency call system receives about 50,000 entries a year, and data has been accumulated over 20 years of operation. Specific keywords are extracted from these records upon their reception, confirmation, and handling, and then sorted by facility and type of equipment. By examining the combination of keywords and the frequency of occurrence, the system can predict inherent risks as well as potential faults in the future and visualize them as an alert. It may also be possible to predict fault occurrences and the time between occurrences by scrutinizing the interrelation between keywords and chronological databases (Fig. 2). In the future, we will use regional features and source building or facility information to try to recognize whether a problem involves an individual building, or if it is a matter to be wrestled with in terms of general measures, and reflect it into building maintenance plans.
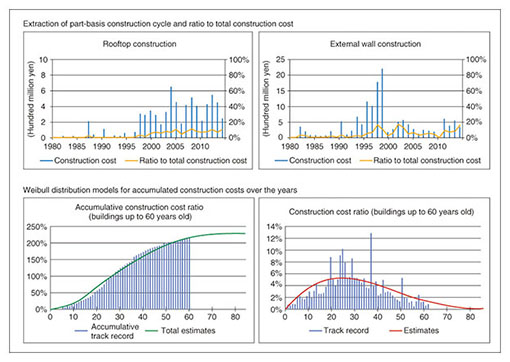
2.3 Application of foundation and construction recordsThe existing telecommunications buildings were built mainly in the peak construction period of Japan’s postwar economic boom, which spans several decades. These building construction records have been used to create a model cycle of periodically required construction work and costs based on the building type, scale, and construction period. This is being utilized to predict when construction work might be necessary as well as the cost (Fig. 3).
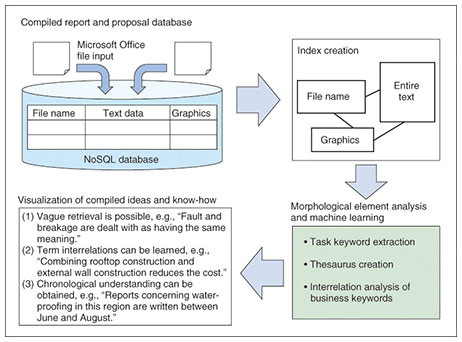
In the event of faults such as leaking roofs or peeling of external walls, simple repairs might be advantageous financially, but the time that passes before the same faults occur again also becomes shorter. On the other hand, although a large-scale repair prevents a fault from recurring for a longer period, it also increases the repair costs. In the event of roof leakage, for example, we can make an accurate and immediate decision on whether to do a simple repair or to carry out a large-scale restoration by considering the right time for construction work with respect to the life cycle of the building. This will lead us to the right conclusion in terms of total cost. 2.4 Information analysis of reports and proposals regarding building maintenance managementOver the last 20 years, NTT FACILITIES has implemented maintenance and management of telecommunications buildings and has also been reporting on maintenance issues and proposing measures to deal with them. The data acquired during this time has been compiled into a massive volume of text and presentation files consisting of various types of data such as figures and photos as well as text. Until now, it has been possible to refer to each type of data individually, but it has been difficult to look at the entirety of the data chronologically. These files were created by maintenance technicians based on inspection and diagnosis results, and they include various kinds of information and know-how as tacit knowledge*2. Making this information explicit knowledge*3 and ensuring that it is systematically applied is a challenge for the future. Handling this information as big data allows us to clarify interrelations between tasks that have previously been performed separately and the correlation between faults or disasters such as typhoons or earthquakes and the effectiveness of countermeasures. This encourages us to strive to improve planning measures (Fig. 4).
In general, it is said that the ratio of the life cycle cost (LCC*4) of a building from its foundation to its demolition and removal is about 25% for construction and 75% for operation. Future building management practices will have to minimize the operational cost that accounts for 75% of LCC by improving task adjustment performance during building operations. In the future, we are going to work systematically on the following objectives by promoting the application of big data to building maintenance and facility management. (1) Establishment of maintenance prediction technology by developing more efficient and lower-cost inspection and diagnosis processes and higher precision of deterioration prediction. (2) Optimization of building maintenance and capital expenditure plans by identifying interrelations and trends that were previously unknown. (3) Overall optimization by considering buildings and facilities as CRE, in relation to real estate utilization. Continuous improvement is aimed for in buildings and facilities in their functions as telecommunications business tools, and practices will be implemented for sustaining them. In order to optimize the maintenance and capital expenditure plans for decades of building operations, it is necessary to relate various kinds of data such as information obtained in the telecommunications business, technical trends, legal or economic shifts in social situations, trends in construction technology, as well as conventional building-related data. Another necessary task is to organize and expand a team of data scientists to apply the compiled data.
3. Application of facility maintenance data3.1 Integrated management system for facility operationNTT FACILITIES operates an integrated management system it developed for facility operation called MaRIA (Maintenance and Remote monitoring, Integrated Advanced management system) that monitors and maintains telecommunications power systems and air conditioning systems in a unified manner (Fig. 5).
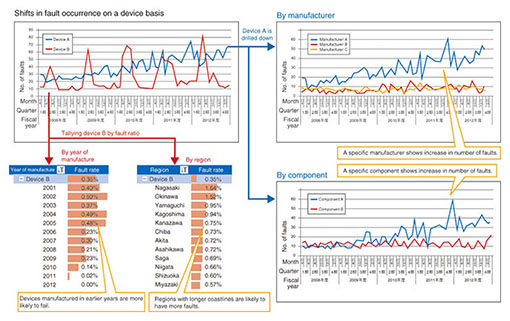
MaRIA monitors alerts issued due to output abnormalities or power outages at facilities as well as alerts regarding measurement values collected by sensors such as those for voltage, current, and temperature. This system immediately informs the Facilities Operation Center of any measurement values that deviate from a threshold range; the appropriate staff then rush into the field from service centers at around 180 locations across the nation. Information on alerts and measurement values is automatically accumulated in the system database. Also, source equipment, fault details, and maintenance records are compiled by maintenance staff at service centers as facility maintenance information. The amount of information the system has accumulated is huge, amounting to 700 million alerts, 30 billion pieces of measurement data, and information on 300 thousand faults. The maintenance data has been utilized to implement monitoring and maintenance work. We are also currently working on other ways to apply the data, as follows. 3.2 Application of fault informationEvery time a fault occurs in an electronic or air conditioning system, a fault card that describes the fault is registered in MaRIA via a web system. The fault card includes information on the five Ws and one H that describe the entire event: when and where (i.e., the geographical location), which equipment, what happened, why it happened, and how it was repaired. This has been utilized for fault management and evidence for replacing equipment in the system concerned. By adding tallying and analysis procedures to this accumulated information, we have developed a tool for multidimensional data analysis that applies various approaches to analyze the information on the compiled fault cards. This contributes to generating new added value (Fig. 6).
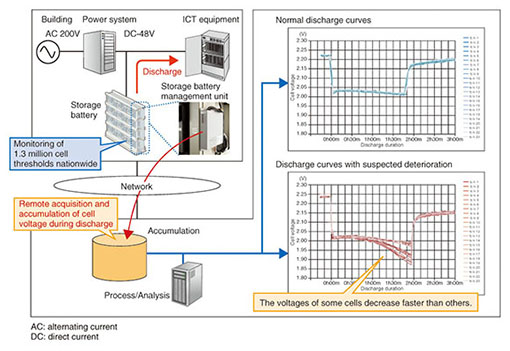
This tool enables any information registered using these cards to be analyzed in a variety of ways. As shown in the figure, general and seasonal trends can be grasped from the shift in the number of faults in each device, and a simultaneous comparison can be done based on a certain manufacturer or a defective component. This allows us to evaluate the situation comparatively using various approaches and to determine, for example, which component of which manufacturer is likely to have more defective parts. Other kinds of comparative approaches can also be done such as a comparison on a cause basis or an installation environment basis, for example, whether it occurred in a power receiving room or a telecommunications room. A fault rate based comparison is also possible by calculating the operational time of the equipment based on information about the initiation and completion date of operation. This enables us to do a comparative evaluation based on the region or on the year of manufacture, even when the number of installations differs. The example in Fig. 6 confirms a general tendency of facilities; the older ones are more likely to fail. In the future, these types of analyses will help to establish the optimum cycles for conducting detailed analyses and for carrying out the appropriate actions for facility maintenance. We will also employ further approaches using statistical analysis in our continued efforts to improve the quality of facility maintenance. 3.3 Prediction of deterioration trends of storage batteriesNTT FACILITIES monitors and maintains storage batteries that are essential backup power systems for telecommunications equipment. Some of our maintenance methods include conducting thermal management procedures to extend the life of storage batteries by managing the temperatures of the environment surrounding the storage batteries and conducting discharge circuit tests to confirm operational normalcy while storage batteries are being discharged. Also, a backup battery for telecommunications equipment consists of several single cells with series connections. The internal resistance of these batteries is also being measured for quality management purposes. Furthermore, the voltage of 1.3 million cells across Japan is being remotely monitored by a storage battery management unit that can measure and manage the voltage of each single cell. We are currently working on predicting trends in deterioration in order to further improve storage battery management by making use of cell voltages that are continuously measured by the storage battery management unit. Conventionally, information on the measured cell voltages has been utilized to determine whether the voltage is normal or abnormal based on upper and lower limit thresholds. We are attempting to predict deterioration trends by compiling and analyzing this information as data values (Fig. 7).
Operational normalcy of the storage batteries is confirmed through the aforementioned examinations such as the discharge circuit test, where storage batteries are periodically discharged. The measured discharge voltages are utilized to create discharge curves with relation to discharge duration and the resulting voltage decrease tendencies. These techniques enable us to evaluate the deterioration state now. The discharge curves of normal storage batteries and ones that might have potential deterioration are shown in Fig. 7, which graphically depicts the voltages of all cells within the same combined battery. The storage batteries with potential deterioration show steeper voltage decreases compared to other cells. In the future, by compiling voltage information on cells during discharge and by analyzing their shift with regard to age, we aim to achieve accurate prediction of deterioration of storage batteries. 4. Future plansIn this article, we described the approaches of NTT FACILITIES in applying field data on buildings and facilities that has been accumulated in the course of maintaining ICT infrastructures. We are fortunate in not only having this vast amount of field data on buildings and facilities but also engineers in each field who can apply and analyze it. With the foresight obtained through these data analyses, we will contribute to improving the reliability of ICT infrastructures and at the same time will strive to create new maintenance services for buildings and facilities. |
||||||||||