|
|||||||||||||||||
|
|
|||||||||||||||||
       |
Feature Articles: R&D on Devices Using Life-assist Technologies Vol. 13, No. 1, pp. 29–34, Jan. 2015. https://doi.org/10.53829/ntr201501fa5 Ultralow-power Sensor Node with Nanowatt Wireless Circuit TechnologyAbstractWireless sensor nodes (WSNs) can be mounted on many kinds of objects in order to gather information about them. This enables a range of applications in areas such as healthcare, security, and traceability. This article describes very tiny, ultralow-power WSNs in which nanowatt wireless circuit technology achieves long-term driving without the need for maintenance. Keywords: sensor node, sensor network, low-power wireless circuit
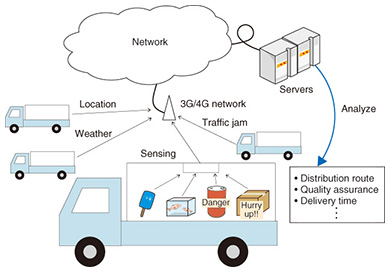
1. IntroductionThe cabability of wireless sensor networks to gather and analyze environmental information such as vibration, temperature, angles, or positions will enable the provision of new services. Such network services, generally referred to as M2M (machine-to-machine) or the Internet of things (IoT), are attracting a great deal of attention. For example, a current sensor attached to electrical appliances in a home can tell us how much electricity is used or saved over time, and it will enable us to control appliances automatically. Sensing vibration patterns caused by wind can indicate cracks in concrete structures of bridges or buildings. A wireless sensor network consists of wireless sensor nodes (WSNs) that can be mounted on anything and can monitor environmental or physical conditions. An image of how cargo in transport is monitored is shown in Fig. 1. WSNs attached to the cargo or to transport vehicles monitor temperature, location, or physical shocks. Then, master receivers connected to a network gather information from the WSNs and send it to servers via public networks such as Wi-Fi*1 or 3G/4G (third generation/fourth generation). The servers store and analyze the data to produce real-time distribution schedules or to maintain quality assurance.
One proposed requirement for WSNs is that they be much smaller in size and lower in cost than whatever they are attached to. Another is that they have batteries if the objects they are attached to do not. However, this last requirement is difficult to meet. Smaller batteries tend to die rather quickly, so we may need to replace them often, which would raise maintenance costs. To avoid this, WSNs should be able to operate on one battery for as long as the item they are mounted on lasts, say about 10 years, without maintenance. In some situations, it may be possible to use ambient energy sources such as solar energy, temperature, or vibration, to charge batteries. In this article, we introduce ultralow-power circuit technology for WSNs as a way to achieve long-term WSN operation with a small battery, and we compare the power consumption of our WSNs to that of a conventional wireless system.
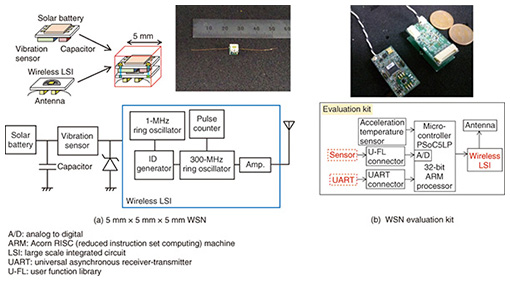
2. Ultralow-power wireless technologyFabricated WSNs with ultralow-power wireless technology are shown in Fig. 2. A 5 × 5 × 5-mm WSN with a solar battery and vibration sensor is illustrated in Fig. 2(a). It transmits identifications (IDs) when the vibration sensor detects a sufficient physical shock. We confirmed in a marketing demonstration that this type of WSN was effective for monitoring which products in a store were most popular by counting the number of times products were removed from store shelves (for purchase or closer examination by customers) [1]. An evaluation kit of WSN with vibration and temperature sensors and a connector for connection to other sensors is shown in Fig. 2(b). WSNs of this type can transmit sensing data at the timing of the sensor’s trigger and timer. We demonstrated the ability of such sensors to monitor indoor temperatures and human heartbeats [2].
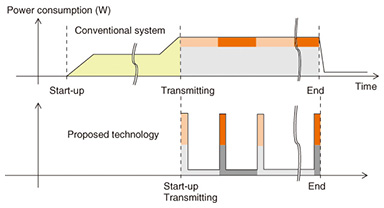
Both types of WSNs feature the large-scale integration of nanowatt wireless circuits. The power consumption of the wireless transmitter from startup to the end of data-block transmission [3] is shown in Fig. 3. We use short impulse signals instead of a continuous sinosidal wave—the conventional method—to transmit “1” and “0” binary data. The pulses are generated by a ring oscillator, and when they stop coming, the wireless circuits also stop. This intermittent-driving technology enables us to reduce the total wireless circuit activation time and achieve ultralow power.
In what follows, we explain the driving energy of WSNs and compare our technology with that of EnOcean*2, a widely known low-power wireless product [4]. EnOcean uses a mechanical energy generator; when the button is pushed, energy is generated and IDs are sent wirelessly into the air. It is popular in Europe, where it is used in buildings to control light switches without electrical wiring.
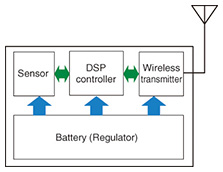
3. Power consumption of WSNsA block diagram of our WSN is shown in Fig. 4. The WSN comprises a wireless transmitter, digital-signal-processing (DSP) controller, sensor, and battery. Here we consider the use of a small lithium battery. The lifetime, L, of the battery is expressed as follows: L [h] = C [mAh] ÷ I [mA] × SF, where C is the energy capacity of the battery, I is the average current consumption, and SF is its safety factor, which corresponds to drops in battery quality due to aging or contamination. For example, if we use a coin-type battery such as a CR2032 with an average current of 1 mA, the battery lifetime is about six days; with an average current of 10 µA, the lifetime is 1.7 years.
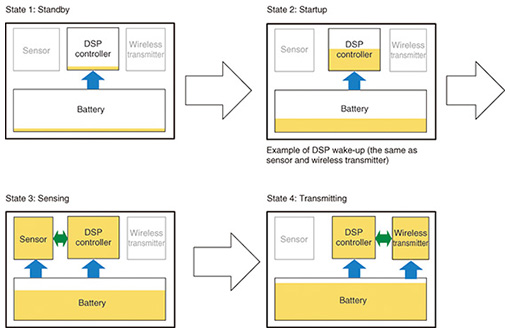
Next we look at the WSN’s power consumption. The power consumption changes with the driving condtions. The driving conditions can be said to comprise the following four states: 1. Standby state: activation of minimum necessary elements of circuits in each block, almost the same as sleeping 2. Startup state: transition to activation of each block 3. Sensing state: environmental sensing and data analysis, including communication between DSP and sensor 4. Transmitting state: wireless transmission Now let us consider the periodic transmission of sensing data. In state 1, most of the components of each block are inactive, and only the minimum necessary elements are activated, for example, the RTC (real-time clock), which counts the periods, and regulators that supply voltage. Some current leakage occurs in this state. The WSN must wake up the DSP controller in order to carry out sensing and transmitting. At this time, the WSN enters state 2 for a while to stabilize the oscillator and to read data stored in memory. Next, the DSP controller instructs the sensor to start sensing to acquire data. This requires state 2 in order to wake-up the sensor block. Then, the state will change to state 3. After data have been acquired, the system enters state 2 again to wake up wireless circuits, and the wireless transmission sequence starts. After state 4, the driving condition returns to state 1. The power consumption of each state is shown in Fig. 5.
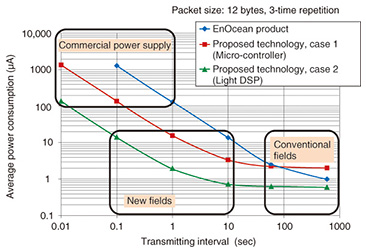
We plot the average power consumption, taking all states into consideration, for transmitting data versus the transmission interval for EnOcean and our ultralow-power technology [5] in Fig. 6. In the EnOcean system, 12-byte data are transmitted three times per cycle. The plot for EnOcean includes the power of the standard sensor and the voltage. When the interval is long, the static energy, corresponding to state 1, is dominant in the total power consumption, and the power becomes constant. In contrast, when the interval becomes shorter, the power consumption increases in proportion to the driving energy of each circuit. EnOcean products are specialized for a button-type power generator, i.e., triggered driving. When they are used periodically, they are useful in long intervals of over 100 seconds.
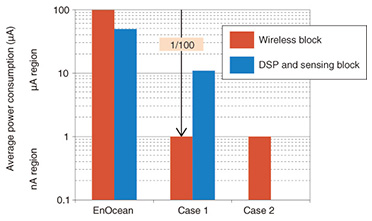
The power consumption for our ultralow-power technology is plotted for the same condition as that for EnOcean—12-byte data with three transmissions per cycle. We consider two cases: using a commercially available micro-controller to transmit sensor data (case 1) and using simple DSP to transmit only IDs (case 2). The power consumption for a one-second interval is shown in Fig. 7. When the interval is short, the differences between EnOcean and our technology become large because the power consumption of our wireless circuits is 1/100 that of the EnOcean product. In EnOcean, the wireless block accounts for most of the power consumption. In contrast, with our technology, the dominant factor in the power consumption for transmitting sensing data is the power used for sensing. Thus, our technology can reduce the total power of WSNs. Moreover, if the system needs only ID information, we can take advantage of the much smaller power consumption of DSP for futher power saving. For shorter intervals, we have to further reduce the power consumption of every block.
When the average power consumption becomes higher than 100 µA, we must use a large energy source such as a commercial power supply instead of a battery (Fig. 6). When the transmitting interval is longer than 100 seconds, the conventional approach, such as that of EnOcean, becomes useful. When the interval is 0.1 to 10 seconds, our technology has substantial advantages over the conventional technology. In such short intervals, data related to human activities, the distribution of things, and production processes are sampled continuously. This will pave the way to new applications. References
|
||||||||||||||||