 |
|||||||||
|
|
|||||||||
|
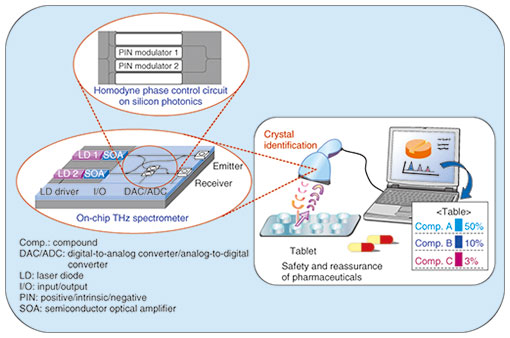
Feature Articles: R&D on Devices Using Life-assist Technologies Vol. 13, No. 1, pp. 42–47, Jan. 2015. https://doi.org/10.53829/ntr201501fa7 Continuous Wave Terahertz Spectroscopy System Designed for Medical FieldAbstractWe have constructed a continuous wave (CW) terahertz spectroscopy system using photonic integration-compatible technology. This system is intended for use in the medical field as a miniaturized terahertz spectroscopy system, in contrast to the conventional pulsed wave method. This system can simultaneously measure the absorption and phase (dielectric constant) responses of a sample, and it exhibits a dynamic range of at least 75 dB at under 1 THz. In addition, we used the CW spectroscopy system to identify a new type of complex molecule crystal (cocrystal) formed from a molecule of a pharmaceutical drug and various coformers. Cocrystals have been developed for use in the pharmaceutical manufacturing field to improve the solubility and absorbability of medicines. By fixing the measurement frequency at the absorption peak of intermolecular interactions of those crystals, we obtained a two-dimensional distribution of cocrystals within a test tablet. Keywords: homodyne, pharmaceutical products, cocrystal 1. IntroductionTerahertz (THz) spectroscopy has been used in the field of astronomy for the past few decades as a form of passive spectroscopy for observing the rotational modes of gaseous molecules. However, as the use of active spectroscopy for analyzing molecules, crystals, and even biological samples has become more common, it has attracted a lot of attention as a new spectroscopic analysis technique. THz spectroscopy involves the penetration of THz waves within a solid, which makes it possible to discriminate the intermolecular interactions between molecules or crystals inside the solid. It is anticipated that it will be applied in areas where it is difficult to apply X-ray diffraction methods such as with materials or ultrafine particles having multiple components that are mixed together. THz waves lie between light waves and microwaves in the range from 0.1 to 10 THz (1011 to 1013 Hz), and therefore, they easily penetrate materials that are not readily transparent to visible light such as paper, wood, and plastic, enabling nondestructive analysis. In the region above 1 THz, there are many vibration modes of molecules or crystals that occur due to the intermolecular interactions. Consequently, the spectral fingerprint, in which the vibration modes absorb THz waves, allows us to identify the materials. The molecular interaction is stronger as the frequency increases. However, the penetration of THz waves within solids tends to decrease because the shorter wavelengths at higher frequencies are easily scattered by particles. Therefore, there is a limited region inside the frequency range from 0.3 to 5 THz where the two advantages of deep penetration and spectral fingerprint are both obtained. Even within the THz spectrum in the low frequency region of 0.1–0.3 THz, it is difficult to identify molecules or crystals even though penetration is easy, whereas in the higher frequency region of 5–10 THz, extremely high loss limits the available sample thickness within thin films or surfaces. 2. Miniaturization of devices and application to medical fieldProcess analytical technology (PAT) is a system for designing, analyzing, and managing the manufacturing process, and for ultimately guaranteeing product quality. The United States Food and Drug Administration (FDA) has published guidelines for introducing PAT into pharmaceutical production. Consequently, there is an increasing need for the analysis of medicines to reassure consumers and increase safety. Accordingly, the application of THz spectroscopy in the medical field requires not only high system performance in areas such as sensitivity, stability, and speed, but also a miniaturized THz spectroscopy system such as an on-chip analyzer for convenient nondestructive inspection of pharmaceutical products. A conceptual diagram of the miniaturized continuous-wave (CW) THz spectroscopy system and its use in the medical field is shown in Fig. 1. Current THz spectroscopy systems generally employ a pulsed wave method based on a femtosecond pulse laser, although it is very difficult to miniaturize certain components such as delay controllers. In contrast, the CW method is less challenging to reduce the size of components because all components from the laser diodes to the THz emitter, receiver, and optical waveguides can be fabricated on chip by using common photonic integration technologies. As a first demonstration, we previously used silicon photonics technology to fabricate a THz phase control circuit only a few square millimeters in size, and we verified the operation of the circuit in the CW THz spectroscopy system [1].
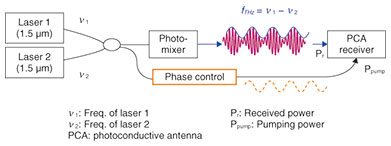
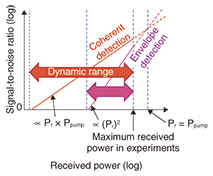
The phase-controlled CW THz homodyne spectroscopy system uses photomixing of light waves from two laser sources, as shown in Fig. 2. The frequency of the THz waves is the same as the frequency difference between the two laser sources. When the THz waves generated from the photomixer arrive at the receiver, a photoconductive antenna (PCA) mixes the THz waves using a phase-controlled replica signal transmitted via an optical waveguide. The principle of homodyne detection enables the use of two general-purpose free-running laser sources such as a 1.55-μm-band semiconductor diode laser, and therefore, THz waves can be simply generated and tuned over a wide bandwidth by changing the wavelength of the lasers. Also, the homodyne detection method still supports the two important advantages of coherent detection methods—detection of both intensity and phase responses, and a high dynamic range. A comparison of the dynamic ranges of the coherent and envelope detection methods is shown in Fig. 3. When Pr is receiving power and Ppump is higher pumped power as noted in Fig. 2, the output from envelope detection (Pr2) is always lower than the output from coherent detection (Pr × Ppump).
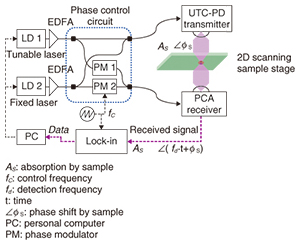
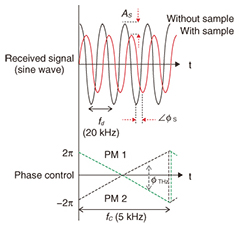
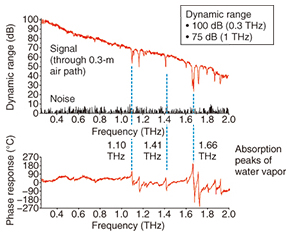
A schematic diagram of a THz spectroscopy and imaging system using the CW homodyne method is shown in Fig. 4 [2]. LD 1 and LD 2 are variable-frequency and fixed-frequency laser diodes, respectively. The outputs of these two laser diodes are amplified by an erbium-doped fiber amplifier (EDFA); then the THz wave is generated by photomixing in a uni-traveling carrier photodiode (UTC-PD). The THz waves from the UTC-PD transmitter passing through the sample on a two-dimensional (2D) scanning stage are then injected into the PCA receiver. Two phase modulators, PM 1 and PM 2, positioned between the LDs and the UTC-PD provide phase control operations for the homodyne detection. The relationship between the controlled phase of the CW THz wave and the received signal waveform is illustrated in Fig. 5. When symmetrical sawtooth waveforms are applied to PM 1 and PM 2, they linearly change the phase shift between –2π and 2π. The received signal then forms a sine wave at a fixed frequency even without a sample. Thus, when a sample is inserted, the THz amplitude (As) and phase (∠ΦS) responses of the sample directly change the received sine wave, enabling the measurement of the THz absorption and dielectric constant of the sample. In this method, the two phase modulators are used to mitigate the limited dynamic range caused by the nonlinearity of both phase modulators. A high dynamic range of 100 dB at 0.3 THz and 75 dB at 1 THz were obtained from the homodyne system, as shown in Fig. 6. Several sharp peaks in the spectra caused by atmospheric moisture were clearly detected with corresponding phase changes.
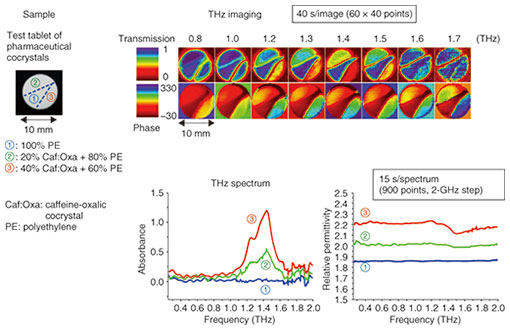
3. Identification experimentAn example of the identification of cocrystal components of a pharmaceutical tablet is shown in Fig. 7 [3]. A test sample containing cocrystals of caffeine and oxalic acid, which has high absorption of THz waves, was used in the experiment. The test tablet was 10 mm in diameter and approximately 1 mm in thickness and contained cocrystals mixed with polyethylene powder. The density of the cocrystals was 20% at the top left and 40% at the bottom right, as shown in the figure. The THz spectrum shown at the bottom of Fig. 7 was measured in 2-GHz steps, and it took approximately 15 s to capture 900 points. We can see that the broad cocrystal absorption peaks are located in the vicinity of 1.4 THz, and the intensity is proportional to density. The dielectric constant also changes at the peak absorption frequency weighted by the cocrystal density. As shown at the top of the figure, the THz images were also measured with the same experimental setup by using the 2D scan at a fixed frequency. Each image consists of 60 × 40 points, and the measurement time was approximately 40 s. This is very fast in comparison with the THz spectroscopy device using pulse waves and a mechanical type of delay stage, where the imaging usually takes several hours. The images at 1.4 THz clearly show the cocrystal distribution because that frequency corresponds to the cocrystal absorption peak. Although the current measurement speed is limited by the movement of the 2D scanning stage, we expect that a faster stage and an advanced scanning method can further improve the speed.
4. Future plansWe introduced the CW THz homodyne spectroscopy and imaging system and demonstrated its usage for a medical application. The CW method has huge potential advantages because of its compactness and fast imaging speed. However, currently, the frequency range possible with the CW spectroscopy system is only in the range of 0.3–2 THz, and the pulse method is superior in measurement sensitivity and bandwidth. Therefore, we are first focusing on developing a higher-power THz CW generator that operates at a wider bandwidth and has higher sensitivity. In addition, it is necessary to improve the method of THz spectrum analysis in order to overcome the difficulty of identifying multiple components in commercially available pharmaceutical products [4]. References
|
|||||||||


