 |
|||||||||||
|
|
|||||||||||
|
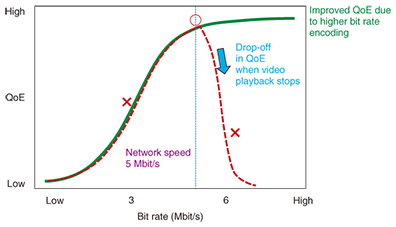
Feature Articles: Dwango × NTT R&D Collaboration Vol. 13, No. 6, pp. 16–19, June 2015. https://doi.org/10.53829/ntr201506fa3 Quality of Experience Optimization Technology (Quality API)AbstractA collaboration between NTT and Dwango Co., Ltd., a video distribution company, is expected to improve the quality of experience (QoE) for customers. This article introduces a QoE optimization technology developed by NTT Network Technology Laboratories. Keywords: QoE, optimization, quality API 1. IntroductionAs smartphones, tablets, and other mobile devices have become more popular, the number of people using video distribution services in mobile space has continued to increase. Unlike wired networks such as fiber optic lines, mobile networks cannot always provide sufficient throughput to distribute high-resolution videos. This occasionally causes videos to stop (for rebuffering) in the middle of playback. A graph of the properties of human perception is shown in Fig. 1. These properties are known to follow an S curve like the green line shown in the figure. If there is sufficient throughput to handle a video’s bit rate, the quality of experience (QoE) follows the line of human perception. If, however, throughput is insufficient, the video will experience rebuffering events, and the QoE will drop precipitously—as illustrated by the red line in Fig. 1 [1].
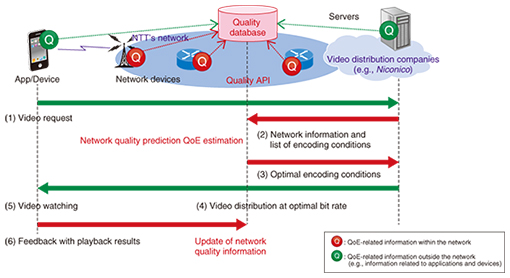
Therefore, it is impossible to maximize the QoE when a video is distributed at a bit rate that is either too high or too low for a network’s throughput. As a result, a video must be distributed at a bit rate that matches network throughput to maximize the QoE; this is what we refer to as QoE optimization. 2. Structure of QoE optimization technology (Quality API)Dwango and NTT have developed an interface, or quality API (application programming interface), for exchanging quality-related information in order to implement the aforementioned QoE optimization. The quality API provides recommended bit rates to video distribution companies in real time. The sequence diagram in Fig. 2 shows how videos are played back using the quality API developed by NTT Network Technology Laboratories.
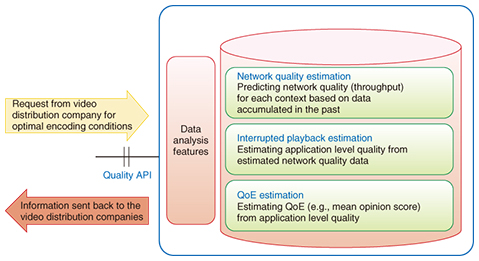
When a user sends a request to a video distribution company to start watching a video, the user’s attributes (e.g., location, network usage, and device information) are sent through the user’s application (app) or browser along with the request (step 1). The video distribution company then sends network information and encoding conditions (bit rate, resolution, and frame rate) for each of several available video quality indicators to the quality API to obtain the optimal encoding conditions (step 2). The quality API then calculates the optimal encoding conditions using a combination of three different technologies to be mentioned later. The encoding conditions with the highest QoE are sent back to the video distribution company in response to its request (step 3). The video distribution company then distributes the video to the user under the conditions it received from the quality API (step 4). After the user has finished watching the video (step 5), information on network throughput is sent to the quality API for future reference (step 6). This allows the latest network quality information to be continually updated and high-precision estimates to be made. The three technologies used by the quality API are indicated in Fig. 3. First, the user’s network quality (throughput and other statistics) is estimated based on the provided network information (network quality estimation). When the request from the video distribution company for optimal encoding conditions arrives in the quality API, the network quality is estimated from records of throughput for similar network conditions in the past as well as from a quality database that collects information related to the usage of network equipment. Simulations are then run based on this estimated network quality to approximate the number of times video playback would stop for each of the encoding conditions (interrupted playback estimation) [2]. Finally, based on the video quality and the number of times that video playback is estimated to stop, data from past subjective evaluations are used to estimate the QoE (QoE estimation) [3].
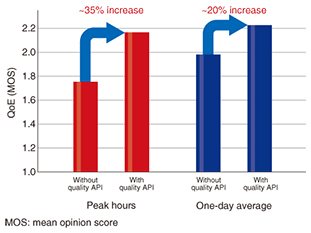
To pinpoint even more precisely the optimal conditions for video distribution, it would be preferable to have user information (when and where they use which services, under what kind of network conditions, using which devices in which states, as well as other information on user behavior and user attributes). However, because this information could contain personally identifiable data, it would thus need to be handled carefully to protect user privacy. 3. Experimental results in collaboration with DwangoExperiments were conducted to determine to what degree bit rates optimized based on recommendations were able to improve the QoE. In the experiments, video playback information was sent to NTT’s quality API for users of Android*1 devices on the NTT DOCOMO LTE (Long-Term Evolution) network on July 3 and 4, 2014. The results indicated that we could expect the quality API to significantly increase the QoE for viewers of Niconico videos. Specifically, we found: (1) Lower incidence of stopped videos We confirmed that this technology was able to reduce the number of users affected by stopped videos from 33% to just 1–2% during peak hours. (2) Improved QoE When we estimated the users’ QoE, we saw an improvement of ~35% during peak hours and ~20% for the one-day average, as shown in Fig. 4.
(3) Lower overall volume of transmitted data A secondary effect of optimizing bit rates with this technology was that we saw transmitted data volumes fall by 17%*2.
4. Future workA field test of this technology was initiated on November 20, 2014, when we began distributing an official Niconico smartphone app that supports the quality API to some randomly selected users of the Niconico video streaming service. This official app has since been downloaded by approximately seven million users. With these tests, we plan to evaluate not only QoE changes but also the effect that QoE improvements have on key performance indicators (KPIs) that are important to businesses that run video distribution services. For example, we plan to move ahead with evaluating KPIs such as engagement, which shows how much of a video a user has watched, and site visit duration, which shows how long services have been used in one day. Finally, we plan to complete a distribution control method that benefits both network and video distribution businesses. References
|
|||||||||||


