 |
|||||||||||||||||||||||||
|
|
|||||||||||||||||||||||||
|
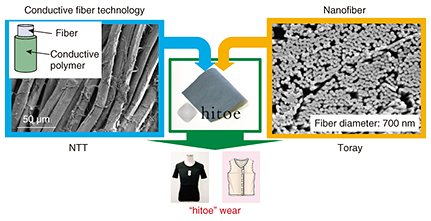
Feature Articles: The Internet of Things and New Value Creation Vol. 15, No. 9, pp. 11–18, Sept. 2017. https://doi.org/10.53829/ntr201709fa3 Natural Sensing with “hitoe” Functional Material and Initiatives towards Its ApplicationsAbstractThis article introduces initiatives to expand the range of applications for “hitoe” wear, clothing that can sense biological data when the user wears it, including services for monitoring rehabilitation patients and bus drivers. It also describes a data collection technology that accommodates the sensors and middleware for storing and analyzing the data, which is called the Fast and Distributed IoT Processing Platform. Keywords: “hitoe” functional material, rehabilitation, driver management 1. IntroductionThe material known as “hitoe” is a new functional material arising from a cross-industry collaboration between NTT and fiber manufacturer Toray Industries, Inc. [1]. It was created using conductive fiber technology developed by NTT by applying a special conductive polymer coating to one of Toray’s latest products, a nanofiber material [2] (Fig. 1). This resulted in a new material that can be used to detect vital data with high sensitivity, even though it is non-metallic. When “hitoe” is worn next to the skin, it can measure vital data such as heart rate and electrocardiographic waveforms, and the level of relaxation can be estimated from R-wave intervals.
Furthermore, “hitoe” does not contain metal, so it is easy on the skin, highly hydrophilic, and durable against sweat and moisture. Thus, it feels like ordinary clothing and can sense vital data very naturally. The nanofibers are finer than fibers generally used for clothing, so they have better adhesion and more contact area with the skin, which enables stable sensing of vital data. The conductive polymer also adheres well, so it is also very durable when washed. In an effort to expand the range of uses for “hitoe,” NTT is working to find practical applications for it in various fields through collaboration between NTT Group companies and external partners. Beyond simply gathering data, it is also important to study how that data can be processed, analyzed, and interpreted to produce high-added-value information. In this case, we have focused on the medical and safety management fields with applications that make use of the strengths of “hitoe,” namely, (1) the ability to obtain stable data even when the subject is perspiring and thus achieve comfortable monitoring over long periods, and (2) enabling more accurate bodily information to be obtained based on electrocardiographic waveforms. This article introduces initiatives to develop applications in rehabilitation patient monitoring and a bus driver management service. We also describe technologies supporting these applications, including data gathering technology that accommodates the sensors and the Fast and Distributed IoT Processing Platform. 2. Rehabilitation patient monitoring and data collection technologyThe goal in monitoring rehabilitation patients is to measure the effects of rehabilitation objectively and contribute to more suitable interventions and faster recovery through 24-hour monitoring of the patient’s heart rate and activity information. Rehabilitation costs in Japan are expected to increase as the population continues to age, and many hospitals are demanding improved rehabilitation quality and effectiveness. On February 7, 2017, NTT, in collaboration with Fujita Health University, Toray, and NTT DOCOMO, began testing to demonstrate the effectiveness of a rehabilitation patient monitoring system using “hitoe” [3]. Fujita Health University Hospital has the largest rehabilitation department in Japan. The purpose of this testing is to investigate the effectiveness and potential of “hitoe” for 24-hour monitoring of patient heart rate and conditions (activity level, position data) and the potential use of such quantitative diagnostic data in the field of rehabilitation. The roles of the university and the participating companies are listed in Table 1.
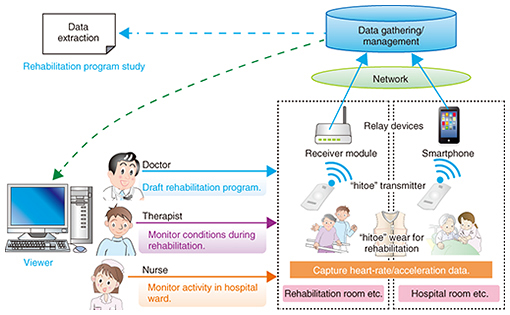
We first describe here the rehabilitation patient monitoring system used in these tests. Activity data output from the “hitoe” transmitter are sent via a Bluetooth*1 Low Energy link to a smartphone or other receiver module and collected on a data gathering and management server through the network (Fig. 2). Doctors and therapists can refer to the activity data stored on this server at any time, 24 hours a day, using a viewer connected to the network. The gathered data could also be used to study rehabilitation programs based on the type or seriousness of the ailment.
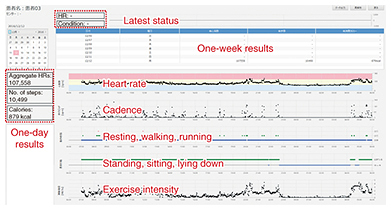
The “hitoe” transmitter has functions to output the heart rate from the electrocardiographic waveform obtained continuously from the “hitoe” wear and to output data such as slope and vibrations from the built-in three-axis accelerometer. The output of a stable heart rate and calculation of activity level is enabled through the use of NTT’s noise cancellation technology. NTT’s acceleration analysis technology can also be used to estimate the cadence or type of movement. The use of a smartphone in hospital rooms and hallways makes it possible to gather data while patients carry out their normal activities. In the rehabilitation room, data can be obtained and sent through a receiver module without a smartphone simply by having patients wear “hitoe” clothing, so rehabilitation activities are not inhibited. Until now, separate devices to monitor heart rate have been necessary in the rehabilitation room and in hospital rooms, and no device was able to record heart-rate conditions continuously. With this new system, the latest data from rehabilitation patients’ activity are always displayed on the viewer (Fig. 3). Results for aggregate heart rates, number of steps, and calories burned can be displayed, with units of days or weeks selected on the calendar. History data can be displayed by graphing daily data and selecting heart rate, cadence, resting/walking/running categories, standing/sitting/lying-down categories, or exercise intensity.
In these experiments, we can visualize the activity data in a composite form and study whether it can contribute to designing rehabilitation programs. Specifically, our scheme consists of the following three steps. 2.1 Step 1: Preliminary study with healthy subjectsHealthy subjects were asked to exercise while wearing “hitoe” wear, and heart rate data were recorded while exhaled air was analyzed and SpO2*2 was estimated. We also measured speed and distance while the subjects were walking. We then checked whether the data obtained from “hitoe” reflected the exercise load. 2.2 Step 2: Study rehabilitation improvement effectsWe had in-patients and out-patients undergoing rehabilitation at the Fujita Health University Hospital Rehabilitation Center wear “hitoe” wear for rehabilitation. We collected the heart rate and activity data (data indicating active or resting, standing or lying down, etc.) while they were in rehabilitation. The collected data were used to check whether the exercise load of the training was appropriate. Also, the viewer can be used to check changes in heart rate or activity during a rehabilitation session or the progress of heart rate and activity in past rehabilitation sessions, so it should be useful for doctors in creating highly effective rehabilitation programs. In these experiments, we are studying what effects the use of “hitoe” can have on creating and conducting rehabilitation programs and on patient recovery. 2.3 Step 3: Evaluating rehabilitation effects with 24-hour monitoring, including life in the hospital wardWhen patients in the rehabilitation department wear “hitoe” wear, their activity in the hospital 24 hours a day can be transmitted. Thus, changes in patient activity could be used to detect activities with a higher risk of falling, and patients prone to becoming bedridden can be encouraged to exercise. We are evaluating the connection between using “hitoe” and early detection of dangerous patient activity, and also promoting activity within hospital wards. Through these studies, we are able to check and verify the effectiveness of “hitoe” in the rehabilitation field. We will work to create services utilizing “hitoe” in this field in the future.
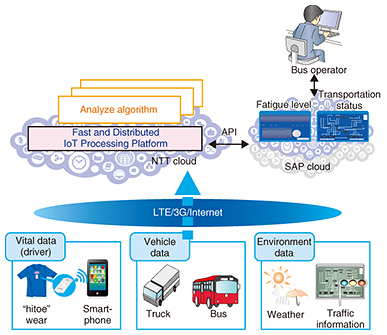
3. Driver management service based on Fast and Distributed IoT Processing PlatformBus travel is a common means of transportation in Japan, so there is a great need for safety for both passengers and drivers. We describe here a system we developed to improve the safety of bus travel. 3.1 Driver management serviceA driver management service is a safety management service that analyzes drivers’ vital data and detects transportation risks. A serious bus accident occurred in Japan in 2016, and since then, the demand for transportation safety management has increased. We developed this service for safety management of bus drivers. An outline of the service is shown in Fig. 4. This service collects vital data, vehicle data, and environment data on a cloud, then visualizes and analyzes the data and takes appropriate actions. Vital data include electrocardiographic waveforms and acceleration of the driver acquired by “hitoe” wear; vehicle data include abrupt handling actions and tire pressure; and environment data include weather, traffic, and vehicle location. For example, the driver management service first visualizes changes in the fatigue level of drivers, then analyzes the correlation of fatigue level and abrupt handling actions or other factors, and finally, it recommends actions such as suggesting the driver take a break based on fatigue level changes.
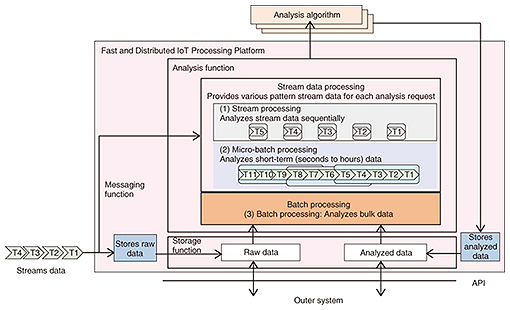
Our driver management service was developed through collaboration between NTT and SAP SE, the enterprise software company. Heartbeat data acquired by “hitoe” wear are analyzed on the Fast and Distributed IoT Processing Platform (described below) in the NTT cloud to estimate the fatigue of the central nervous system (brain and spinal cord) when the driver is driving, and the fatigue data are then output. Coordination between the NTT cloud and SAP cloud is achieved with a representational state transfer (REST) application programming interface (API), and vital information such as fatigue data are provided to the SAP cloud via this and other APIs. The vehicle and environment data are collected in the SAP cloud, and all of the information, including the fatigue data, is visualized using a web graphical user interface (GUI). Then, appropriate actions are taken using service coordination technologies, for example, as in the work described in a published study [4]. Operators in bus companies can confirm the total information of bus location, driver fatigue, and other data by checking the web GUI. We conducted a field trial of the driver management service with Keifuku Bus Co., Ltd. in Fukui Prefecture in October and November, 2016. About 15 drivers participated in the field trial. The drivers wore “hitoe” garments, enabling us to collect stable data. From the data, we were able to verify the validity of fatigue estimation and the feasibility of real-time fatigue estimation analysis. We also confirmed various business aspects such as the operational feasibility of this service and the effectiveness of the analyzed results. We discussed how to improve bus operations with Keifuku Bus based on the trial results (e.g., bus schedule changes). NTT Communications launched a commercial driver management service after the completion of this trial. 3.2 Fast and Distributed IoT Processing PlatformWe explain here the Fast and Distributed IoT Processing Platform on which the driver management service runs. The Fast and Distributed IoT Processing Platform has been developed by the NTT Software Innovation Center and is a platform to collect, store, and analyze Internet of Things (IoT) data. This platform was built based on cloud technologies (e.g., that described by Yamato et al. [5]) and can use information obtained not only from “hitoe” wear but also from various sensor devices. The Fast and Distributed IoT Processing Platform has a data storage function, a data analysis function, and a messaging function that connects the other functions. There are other IoT platforms such as Amazon AWS IoT*3 and Microsoft Azure IoT Suite*4. These platforms also have similar storage, analysis, and messaging functions. However, our platform has a lower price structure thanks to the use of open source software (OSS). It also has a flexible structure, with functions that can be customized for each project. An outline of the Fast and Distributed IoT Processing Platform is shown in Fig. 5. Sensors such as “hitoe” wear continuously collect IoT data (also called stream data), and the IoT data are transferred to a cloud by smartphones or other gateways. The data are delivered to the storage and analysis functions by the messaging function. The Fast and Distributed IoT Processing Platform uses Apache Kafka*5 for the messaging function, Apache HBase for the storage function, and Apache Spark for the analysis function.
In the driver management service, stream data of heartbeat and other vital information acquired by “hitoe” wear are transferred to the Fast and Distributed IoT Processing Platform by smartphones. Kafka delivers data to HBase for storing and Spark for analyzing. Spark processes the stream data through the micro-batch processing of Spark Streaming and estimates the fatigue level. Micro-batch processing is a kind of processing that analyzes short-term data (seconds to hours) and is an intermediate type of processing between batch processing and stream processing. Because fatigue is estimated based on fluctuation of heartbeat R-wave intervals, micro-batch processing is suitable for analyzing heartbeat data for particular periods. In the driver management service, one minute of heartbeat data is analyzed in a micro-batch. We are now developing additional functions to select not only micro-batch processing of Spark Streaming but also batch processing and stream processing for the analysis function by agile software development based on previous OSS development experience. These analysis functions can be configured in various patterns for each project. For the analysis algorithm that runs on the analysis function, we can run not only the fatigue estimation algorithm*6 described above but other algorithms as well. Analyzed data such as fatigue level and raw data are stored in the storage function. Stored data are utilized in periodic batch analyzing or outer system coordination via a REST or other API. In the driver management service, our system provides analyzed data to the SAP cloud at regular intervals and also when the analyzed data exceed certain threshold values.
4. Future prospectsIn this article we introduced examples of two “hitoe” applications. In our initiatives towards rehabilitation patient monitoring, we will continue to promote research and development of our monitoring system so that it can collect data seamlessly, whether in the hospital, at home, or away from home, for both home rehabilitation and home medical care in the future. We also plan to utilize the Fast and Distributed IoT Processing Platform in rehabilitation applications. We also introduced a bus driver management system and the Fast and Distributed IoT Processing Platform to support it. We will continue to use the Fast and Distributed IoT Processing Platform to analyze the data collected using “hitoe” wear and other sensors and will promote other projects using it in business. References
|
|||||||||||||||||||||||||


