|
|||||||||||||
|
|
|||||||||||||
       |
Practical Field Information about Telecommunication Technologies Vol. 20, No. 4, pp. 80–84, Apr. 2022. https://doi.org/10.53829/ntr202204pf1 Development of Loss-evaluation Tool for Efficient Characterization of Optical Fiber CablesAbstractIn conjunction with the spread of the Internet, optical fiber cables have been deployed across Japan to provide a wide variety of Internet protocol services. Since optical fiber cables are installed in various environments, their transmission loss may vary due to stresses such as unintended bending, vibrations caused by passing cars and wind, and aging caused by environmental conditions. Generally, transmission loss in optical fiber cables is evaluated using an optical time domain reflectometer (OTDR); however, to evaluate the condition of optical fiber cables from the data acquired for each fiber, a certain amount of knowledge and experience has been required. Therefore, NTT EAST Technical Assistance and Support Center has been developing a tool that makes it possible to easily evaluate the loss in optical fiber cables from the OTDR measurement data. This article introduces our developed loss-evaluation tool and its functions. This is the sixty-ninth article in a series on telecommunication technologies. Keywords: optical time domain reflectometer, transmission loss, waveform analysis
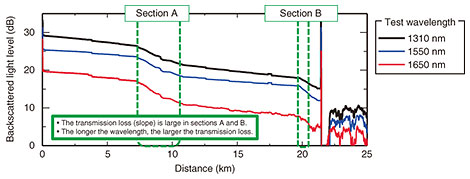
1. IntroductionOptical fiber cables enable high-speed, broadband, and high-capacity communications, thus are being deployed across Japan as a social infrastructure not only to support the spread of the Internet and cell phones but also provide new applications using the Internet of Things and artificial intelligence [1]. Since these optical fiber cables are installed both above and below ground in urban and mountainous areas, they are affected by the surrounding environmental conditions such as unintended bending and vibration due to earthquakes and typhoons, and deterioration due to the installation environment. Since these effects often appear as transmission loss in optical fibers, it is important to periodically evaluate such loss as part of cable maintenance [2]. An optical time domain reflectometer (OTDR) is generally used to evaluate transmission loss in optical fiber cables. With OTDR, optical pulses are injected into the optical fiber, and the intensity of Rayleigh backscattered light is measured as a function of round-trip delay time, which is proportional to the distance along the fiber. Accordingly, it is possible to measure the loss distribution as a function of distance along the fiber [3]. 2. Evaluation of transmission loss in an actual optical fiber cableFigure 1 shows an example of transmission loss in an optical fiber cable measured using an OTDR with three different test wavelengths. If an optical fiber cable is deployed in a normal state, its transmission loss increases with a constant slope with distance along the fibers (generally about 0.2 dB/km at wavelength of 1550 nm) [4]. Therefore, the waveform measured using an OTDR (i.e., intensity of Rayleigh backscattered light) decreases towards the right of the graph. At fiber-splice points, step-like changes in loss (which are associated with the splice conditions) can also be observed.
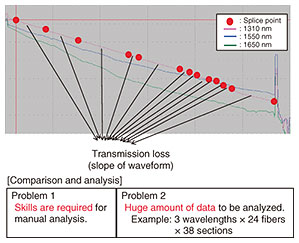
As shown in Fig. 1, there are steep-slope sections in addition to the step-like loss at the splice points in the OTDR waveform. Comparing the OTDR waveforms among test wavelengths reveals that the slopes of these sections are steeper at the longer wavelength (1650 nm). Because of the wavelength dependence of the loss, it is assumed that stress-induced bending occurs throughout these sections. From the results of previous studies, it is known that such stress tends to increase not only with sudden environmental changes due to disasters but also with cable aging [5]. 3. Overview of tool for evaluating transmission loss in optical fiber cables3.1 Conventional method for evaluating transmission lossFigure 2 shows the method for evaluating optical fiber transmission loss during conventional maintenance. The evaluator places markers (red lines) on the waveform measured with an OTDR and reads their intensity values to evaluate the change in loss and slope between markers. However, the values often vary according to the evaluator in question, and a certain level of experience and skill is required of the evaluator. Moreover, when a large number of optical fiber cables are measured with multiple wavelengths, the amount of data to be evaluated becomes enormous, and handling such a large amount of data is time-consuming and labor-intensive.
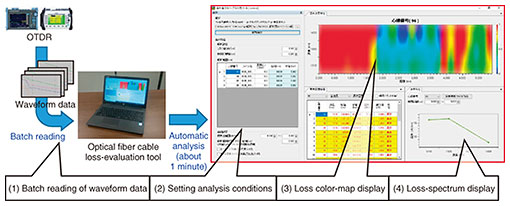
3.2 Overview of optical fiber cable loss-evaluation toolFigure 3 shows the optical fiber cable loss-evaluation tool developed by NTT EAST Technical Assistance and Support Center (TASC). The tool has the following four key features: (1) Batch-reading function for multiple OTDR measurement data (2) Normal/abnormal judgment based on arbitrarily adjustable analysis conditions (loss threshold, etc.) (3) Display of a color map of loss per unit length of the optical fiber cable (4) Display of loss (loss spectrum) for each test wavelength
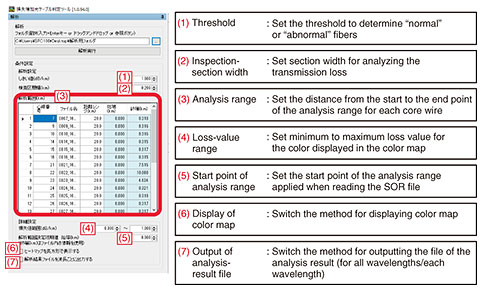
Each feature is briefly described in the following sub-sections. 3.2.1 Batch reading of waveform dataTo check the loss status of an optical fiber cable, testing at multiple wavelengths is effective. Accordingly, our tool was designed on the basis of multiple OTDR measurement data obtained with three or four wavelengths. When saving the multiple OTDR measurement data as the file name “(4-digit fiber number)_(wavelengths)_(free text).SOR” (SOR: Standard OTDR Record), the tool can read the multiple measurement data at once and sort them by using the first four digits of the file name as a key and recognizing the wavelength information from the second part of the name. 3.2.2 Setting analysis conditions and normal/abnormal judgmentFigure 4 shows an example of the condition-setting screen of the tool. Seven items can be set: (1) threshold, (2) inspection-section width, (3) analysis range, (4) loss-value range, (5) start point of analysis range, (6) display of color map, and (7) output of analysis-result file. Arbitrarily adjusting these seven items makes it possible to evaluate losses in accordance with the purpose.
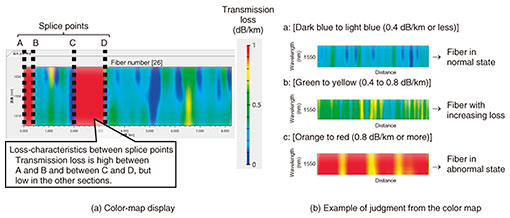
3.2.3 Display of color map of loss distributionFigure 5 shows a color map of the loss distribution obtained by analyzing the OTDR measurement data.
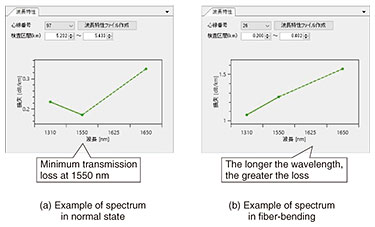
In Fig. 5(a), the horizontal axis represents the distance along the optical fiber cable, and the vertical axis represents the wavelength. In certain sections, namely, between splice points A and B and between C and D, transmission loss exceeds the threshold. The change in the color map against the loss value is shown in Fig. 5(b). When the threshold of the slope of the OTDR waveform is set to 1 dB/km, loss values below 0.4 dB/km are indicated in dark blue to light blue. When the loss values are in 0.4 to 0.8 dB/km, the corresponding sections are indicated in yellow-green to yellow. Sections with loss exceeding 0.8 dB/km are indicated in red, so the loss along the length of the optical fiber cable can be checked at a glance. 3.2.4 Display of loss spectraFigure 6 shows an example of displaying wavelength dependence of loss (loss spectrum) in a certain section of an optical fiber cable. The horizontal axis shows the wavelength of the test light, and the vertical axis shows loss.
For glass optical fibers, loss per distance is lowest at the wavelength of 1550 nm and increases when measured at shorter or longer wavelengths. As shown in Fig. 6(a), analyzing the OTDR measurement data reveals that loss at 1550 nm is minimum for a normal cable. As shown in Fig. 6(b), however, when the optical fiber is subjected to bending, the loss increases with increasing wavelength. Therefore, it is possible to estimate the state in which loss occurs by checking the status of the loss spectrum. 4. ConclusionWe introduced our loss-evaluation tool for efficient characterization of optical fiber cables. Using this tool makes it possible to check at a glance the loss status of optical fiber cables, improving the efficiency of maintenance work. The tool is currently being used by maintenance personnel of NTT EAST and NTT WEST on loan from TASC or used by TASC for analyzing measurement data provided by such maintenance personnel. We plan to further improve the tool so that we can, for example, use the results of periodic tests to analyze changes in loss over time. At the Access Network Engineering Group, TASC, we provide technical support for solving difficult-to-solve problems of access network equipment that occur in the field across Japan. By applying the skills obtained through technical support and knowledge obtained by investigating the causes of problems, we will continue to contribute to solving such problems and develop tools for improving technical skills and efficiency in the field. References
|
||||||||||||