|
|||||||||||||||||||||||||||||||||||||||||||||||
|
|
|||||||||||||||||||||||||||||||||||||||||||||||
       |
Regular Articles Vol. 20, No. 6, pp. 34–42, June 2022. https://doi.org/10.53829/ntr202206ra1 How ICT Contributes to Carbon NeutralityAbstractTo achieve carbon neutrality, we need to reduce greenhouse gas (GHG) emissions to net-zero at the global level by the middle of the 21st century. In September 2021, the NTT Group announced the new environmental and energy vision “NTT Green Innovation toward 2040,” which formulates that the NTT Group will not only aim for carbon neutrality in 2040 but also contribute to reducing the environmental impact of society by simultaneously expanding the adoption of Innovative Optical and Wireless Network (IOWN) technologies and new information and communication technology (ICT) services. ICT can potentially contribute to reducing environmental impact in many sectors through optimizing production and consumption activities, improving energy efficiency, reducing the movement of people and goods, and so on. Therefore, ICT is expected to help us achieve a carbon neutral society. This article introduces our estimation model for analyzing the potential contribution of ICT usage to future environmental load reduction and economic growth. By covering the targeted 36 ICT services that are widely used or will spread in the near future in Japan, including those provided by NTT, this model will quantitatively analyze the environmental and economic impact of introducing these ICT services by 2030. Keywords: ICT, carbon neutrality, GHG
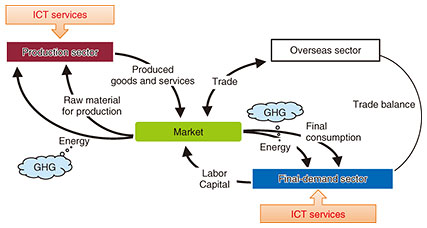
1. IntroductionThe impact associated with the progress of climate change has become more serious. The Paris Agreement, adopted in 2015, showed that the goal is to limit global warming to well below 2ºC, preferably to 1.5ºC, compared with pre-industrial levels [1]. The Special Report “Global Warming of 1.5ºC” and the IPCC Sixth Assessment Report published by the Intergovernmental Panel on Climate Change (IPCC) then indicated the importance of keeping the temperature rise at or below 1.5ºC to avoid significant risks [2, 3]. To achieve the 1.5ºC target, we need to reduce greenhouse gas (GHG) emissions to net-zero at the global level by the middle of the 21st century. Many countries set their GHG-emission reduction targets toward carbon neutrality in 2021. In response to this situation, many companies have announced their ambitious GHG-emission reduction targets, and various climate-change measures are being taken to achieve them. The NTT Group announced the new environmental and energy vision “NTT Green Innovation toward 2040” in September 2021 [4]. Toward societal well-being, the NTT Group aims to increase its corporate value through environmental, social, and governance (ESG) initiatives and simultaneously achieve the conflicting objectives of zero environmental impact and economic growth by “Reduction of Environmental Impact through Business Activities” and “Creation of Breakthrough Innovation.” The new environmental and energy vision formulates that the NTT Group will aim for carbon neutrality by 2040 and contribute to reducing the environmental impact of society by simultaneously expanding the adoption of Innovative Optical and Wireless Network (IOWN) technologies and new information and communication technology (ICT) services. Although ICT use causes environmental load in its own sector (e.g., electricity consumption of ICT equipment), ICT can potentially contribute to reducing environmental impact in other sectors through optimizing production and consumption activities, improving energy efficiency, reducing the movement of people and goods, and so on [5, 6]. ICT is expected to contribute to achieving carbon neutrality by further reducing its energy consumption and reducing the environmental impact of society as a whole. This article introduces our estimation model for analyzing future environmental and economic impact of ICT usage. By covering the targeted 36 ICT services that are widely used or will spread in the near future in Japan, including those provided by NTT, this model will quantitatively analyze the environmental and economic impact of introducing these ICT services by 2030. 2. Estimation model2.1 Previous studies and issuesBerkhout and Hertin recognized that the relationship between ICT and environmental impact is ‘complex, interdependent, deeply uncertain, and scale-dependent’ [7]. Several methods have been proposed for assessing the positive and/or negative environmental effects of ICT use [8–11]. For a single ICT service from a bottom-up approach, Recommendation L.1410 published by the International Telecommunication Union - Telecommunication Standardization Sector (ITU-T) proposed a method for the environmental lifecycle assessment (LCA) of ICT goods, networks, and services [9]. The method can identify the key factors driving carbon dioxide (CO2) emissions from each life stage of ICT use. Since it requires a large amount of detailed micro-level data, it is more suitable for specifically analyzing individual ICT. However, it is difficult to determine the overall effects at a country level or for future forecasts. Bieser and Hilty used a macro-method based on 12 ICT use cases (such as e-health) [12]. They estimated the level of ICT adoption and the impact on GHG emissions of ICT adoption in each use case and compared them with a baseline. Hilty reviewed studies for more complex effects of ICT use, such as rebound effects and spillover effects, across industries [13]. With the above methods, however, it is difficult to determine the overall impact, especially when considering future impact. To determine the overall impact at the macro-level, including complex effects, computable general equilibrium (CGE) analysis as a top-down approach is more suitable than the above bottom-up approach. However, few studies have analyzed the environmental effects of ICT usage from this approach, due to the complexity of expressing and assessing the effects of ICT introduction in the CGE model and the large amount of actual effect data required. We combined a bottom-up approach, which is mainly based on the LCA method, and a top-down approach, i.e., CGE analysis, and developed a dynamic CGE model to forecast macroeconomic and environmental impact [5]. The method has also been consented as ITU-T Recommendation L.1451 [10]. 2.2 Estimation modelA CGE model replicates the input-output (IO) tables in a given region as a set of simultaneous equations and usually covers all goods and industry sectors in the evaluated region. Our CGE model is based on the AIM/CGE [Japan] of the Asia-Pacific Integrated Model [14]. Our CGE model is disaggregated into 49 sectors and 43 commodities on the basis of the IO table in 2005 [15]. Sectors are listed along the horizontal axis in Fig. 3, and equations used in our model are those from Masui [14]. Figure 1 shows the structure of our CGE model. The final-demand sector (households) holds the production factors of capital and labor, which are provided to the production sector in exchange for income. The income received is used to purchase consumer goods or saved; thus, households maximize their utility in purchasing consumer goods, and savings are converted into capital in the next year. The production sector (enterprises) uses production factors (labor and capital) and intermediate inputs (e.g., energy and raw materials) to produce products and supply them to the market. Enterprises conduct production activities to maximize their profits on the basis of their production technologies. The supply and demand for goods and production factors are balanced in the market, and the price mechanism determines the levels of activity and value of goods, services, and production factors. Production efficiency in the production sector and consumption efficiency in the final-demand sector are expected to improve when ICT services are used in the production and final-demand sectors.
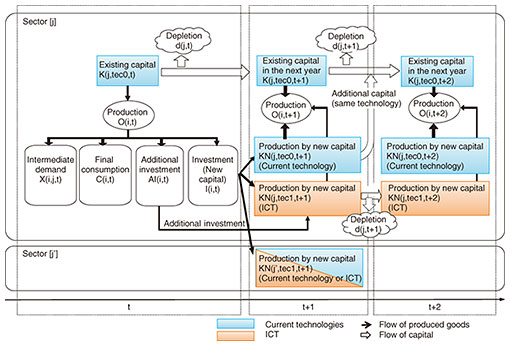
Figure 2 shows the process of capital accumulation and production in the model. The equilibrium calculation starts from 2005. The capital stock in 2006 depends on depreciation of existing capital and investment from 2005 and determines efficiency levels in 2006. Equilibrium for the current year is then calculated on the basis of the prepared efficiency levels, and the model runs year by year in this manner. New capital can be introduced in any sector but cannot be changed once introduced. Allocation of new capital is endogenously determined to achieve the maximum profit in the equilibrium calculation. Preconditions, such as future population change, expected economic growth rate, and share of power-generation technology, are set as given. In this model, by allocating the new production investment with ICT services, new ICT services will be possible. New capital to provide ICT services will be allocated year by year. Expansion on the share of new capital to provide ICT services expresses the spread of such services.
2.3 Target ICT services and future scenarios2.3.1 Evaluation of target ICT services and direct effects expected from ICT useThirty-six ICT services in six industry categories are covered in this estimation. Table 1 shows representative ICT services in each industry category. ICT services that are commonly used, such as teleworking and online shopping, have relatively high penetration rates [16]. Even though newer ICT services, such as artificial intelligence (AI) and Internet of Things (IoT), have lower penetration rates than the older ICT services, they have started to be used in some industries such as manufacturing and distribution and services. Thus, their effects on GHG-emission reduction are expected to be great in the near future.
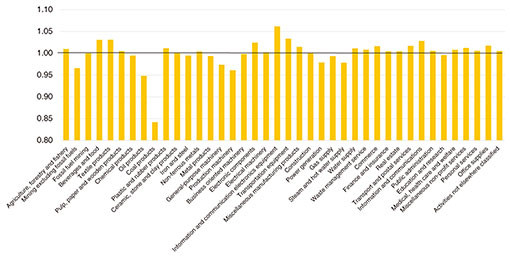
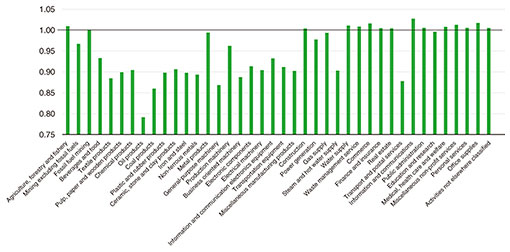
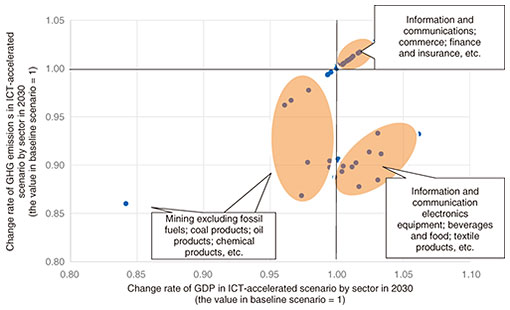
The direct effects expected from the use of these ICTs are surveyed using statistical data, forecast reports for future ICT, and use cases that have been introduced in factories or banking [17, 18]. The values of direct effects are estimated by the total amount of evaluated activity and amount reduced by ICT use. These effects are then fed back to the intermediate input coefficients of the CGE model. 2.3.2 Future ICT scenariosTwo scenarios until 2030 are presented to evaluate the impact of using ICT services: baseline scenario and ICT-accelerated scenario. For both scenarios, input data between 2005 and 2015 are set to be the same and are based on statistical data. From 2016, basic preconditions until 2030 (such as population changes and expected gross domestic product (GDP) growth rate) are set to be the same and based on Japan’s Intended Nationally Determined Contributions [19]. To clarify the effectiveness of the treated ICT services, in the baseline scenario, all technology levels on energy efficiency from 2016 to 2030 are assumed fixed at their 2015 levels. In the ICT-accelerated scenario, future penetration rates of the most widely used ICT services are estimated to grow by linear approximation on the basis of past statistical data [e.g., 16], since linear approximation could best approximate the past data for them. Newer ICT services are boldly assumed to spread to high levels in our model, since penetration rates of most of these ICT services have not yet been predicted, and the purpose of this article is to show the potential impact of ICT use. For most of these new services, utilization rates are assumed to be up to 50%. Additionally, the spread of AI technology for distribution is not a strong prospect since it strongly depends on automated driving. The final three columns in Table 1 list the details of the future scenarios for the targeted ICT services. Investment values to the ICT sector between 2005 and 2020, such as equipment investment or software development, are from a market survey report on the ICT-related market [20], and the values until 2030 are estimated by linear approximation on the basis of the existing data. 2.4 Power consumption in ICT sectorTo support these future ICT services, a large amount of ICT equipment will be needed such as sensors for collecting the data, edge computers, data servers, and fifth-generation mobile network equipment. Thus, the increase in power consumption by ICT equipment is a serious concern. We also investigated and analyzed power-consumption trends of ICT equipment use in the ICT sector in Japan up to 2030 on the basis of data between 2008 and 2018 and related reports on ICT-market forecasts [e.g., 21]. The ICT sector includes fixed/mobile networks, datacenters, and end-user devices. To determine the power-consumption trends of the ICT sector, we attempted to estimate the total power consumption of ICT equipment until 2030 by estimating the changes in the number of each type of ICT equipment and changes in the power consumption per unit of each type of equipment and multiplied the two values. The numbers of each type of ICT equipment are estimated to grow by linear approximation on the basis of past statistical data [21]. Regarding changes in the power consumption of various ICT equipment, since it is difficult to determine all details of all types of equipment, we investigated the relationship between the power consumption of ICT equipment and number of operating units, represented by servers. The results indicate that the power consumption per operating number of server devices was almost flat [22]. This is considered due to the fluctuation being offset by certain main factors such as the recent increase in the amount of communication traffic, improvement in the information-processing capacity of ICT equipment, and improvement in the energy-saving performance of equipment. On the basis of the results, three cases are assumed when estimating the power consumption in the ICT sector up to 2030. The power consumption per unit of ICT equipment is assumed to (1) remain unchanged, (2) be + 1%/year, and (3) be + 2%/year. By multiplying each case by the number of operating units of various ICT devices, the power consumption in the ICT sector by 2030 can be estimated. In accordance with the estimation results, the electricity consumption in the ICT sector in 2030 was estimated to be about 1.2 to 1.5 times higher than in 2020. In the CGE model calculation, the upper limit of 1.5 times is adopted, and the power consumption increase in the ICT sector is expressed as service demands for ICT in non-ICT sectors. 3. Estimation results and discussionCompared with the baseline scenario, the results in the ICT-accelerated scenario showed a 1.3% increase in total GDP and 4.7% decrease in GHG emissions in 2030, which indicate the possibility of a decoupling of economic growth and environmental impact. The main reason is considered to be that electricity consumption in the ICT sector only accounts for a few percent of Japan’s electricity consumption, and the increase in electricity consumption in the ICT sector was offset by the decrease in intermediate input in other sectors due to the introduction of ICT. Figure 3 shows the details of the production value by sector. In addition to the increase in the production value of information and communication equipment and the information and communication sector, the production value of many service sectors will also increase slightly. The reason is thought to be that the reduction in labor input by introducing ICT services such as AI improved production efficiency. Due to the increase in total GDP, household income and the production value of the beverage and food sector, which is directly linked to final consumption, also increased. There was also a decrease in the production value in the mining industry and sectors such as petroleum, coal, and production machinery. The GHG emissions by sector (Fig. 4) will decrease in the majority of sectors. It was found that the decrease in the demand of petroleum, coal, steel, and non-ferrous metals, and the transportation sector was significant due to the improvement in production efficiency and reduction in the movement of people and goods through the introduction of ICT. The above-mentioned tendency is also clear from Fig. 5, which shows the production amounts and GHG-emission change rate in the ICT-accelerated scenario compared with those in the baseline scenario by sector. The most promising is the lower right quadrant, where GHG emissions decrease as production value increases. However, as shown in the lower left quadrant, reducing the dependence on the coal and oil industries is also important for the future conversion to a decarbonization society.
The purpose of this type of scenario analysis is to show potential future scenarios rather than correctly predicting the future and present ways to move toward a more desirable future. In that sense, more scenario settings may need to be studied by taking into account the above concerns. 4. ConclusionWe developed a dynamic CGE model to analyze the future environmental and economic impact until 2030 brought about by popularization of 36 ICT services, considering both positive GHG reduction effects of ICT use in non-ICT sectors and GHG emissions caused by ICT equipment’s operation in the ICT sector. The model results indicate that besides the development of ICT-related sectors, the spread of ICT services, especially certain AI-based services, can improve productivity through labor-saving and better matching of supply and demand and contribute to increasing overall GDP. The results also indicate that GHG emissions will not increase, since the power consumption of ICT services is a relatively small part of overall power consumption, and the increase in service demand for ICT may affect other inputs and offset them. Efficiency of logistics and manufacturing can greatly reduce the input of oil and coal products, thus drastically reducing GHG emissions. In 2030, compared with the baseline scenario, at least 1% additional GDP growth and 4% GHG-emission reduction can be expected by introducing targeted ICT in the ICT-accelerated scenario, which also means the feasibility of decoupling the economic and environmental effects of ICT use. Due to the COVID-19 pandemic, the world is changing significantly and will continue to do so. The pandemic has triggered a major advance in ICT throughout the world. In Japan, “Remote World” supported by various digital technologies including IOWN, a new concept proposed by the NTT Group, is expected to lead us towards a lower-carbon society. References
|
||||||||||||||||||||||||||||||||||||||||||||||