|
|||||||||||||||
|
|
|||||||||||||||
       |
Feature Articles: ICT Platform for Connected Vehicles Created by NTT and Toyota Vol. 20, No. 7, pp. 83–88, July 2022. https://doi.org/10.53829/ntr202207fa12 Technology for Calculating Suddenness Index for Aggregated ValuesAbstractWe developed a technology for calculating the suddenness index for aggregated values to reduce the amount of computation and communication for video processing needed to detect lane-specific traffic jams. This technology aggregates the number of connected vehicles for each mesh on a map and quantifies the degree of deviation from the ordinary state. This article gives an overview of this technology and describes the value it provides and future issues based on the verification conducted for this lane-specific traffic-jam use case in field trials. Keywords: statistical analysis, CAN, traffic-jam detection
1. Issues regarding detection of lane-specific traffic jamsNTT Smart Data Science Center aims to provide advanced driving support and optimize traffic flow by detecting lane-specific traffic jams using video analysis, thus providing more detailed traffic-jam information faster than conventional services. To identify the exact location and length of a lane-specific traffic jam, dashcam videos of connected vehicles running in the lane adjacent to the congested lane are collected into the cloud where image processing [1] is executed. This process presents a problem in that a large amount of communication is required to collect the video data and a large amount of computation is required to analyze the data. To solve this problem, NTT Smart Data Science Center developed a technology for calculating the degree of suddenness of the increase or decrease in the latest number of vehicles compared with the number of vehicles in the ordinary state, which is quantified and called the suddenness index for aggregation values, or just suddenness index, SI [2]. It uses controller area network (CAN) data, which feature a small data size, and identifies roads (or meshes* on a map), the videos of which need to be collected and analyzed with high priority. By collecting and analyzing only high-priority videos, it is possible to reduce the amount of both communication and computation.
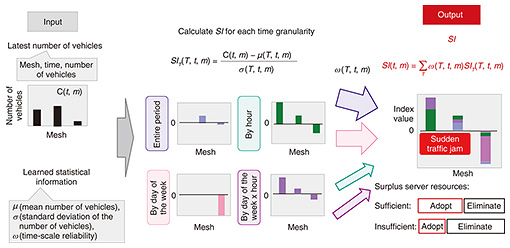
2. Which roads have high priority for video analysis?Compared with traffic jams in areas where traffic volumes are predictable, such as areas with little change in traffic volume or where traffic jams occur periodically, lane-specific traffic jams that occur unexpectedly and suddenly are more likely to trigger new accidents. Therefore, it is important to provide advanced driving assistance in areas that are prone to such sudden lane-specific traffic jams. Traffic jams in the former category include those that occur on arterial roads and right/left-turn lanes, which become congested during the morning and evening rush hours, and at entries to commercial facilities that are crowded on weekends and holidays. Such traffic jams can be predicted on the basis of historical data, and the video-analysis results of past traffic jams have already been accumulated. Therefore, the analysis of videos of such areas has low priority, especially when remaining server resources are scarce. Lane-specific traffic jams in the latter category include those caused by an extreme reduction in traffic capacity on the road due to an accident or vehicle breakdown, those caused by the opening of a new commercial facility, and those caused by changes in people’s daily habits, such as a sudden rise in demand for drive-through services due to the COVID-19 pandemic. Such traffic jams are difficult to predict from historical data. Therefore, it is a matter of high priority to understand the traffic situation in such cases through video analysis. By giving high priority to lane-specific traffic jams that occur unexpectedly, it is possible to reduce the amount of both communication and computation required. 3. Issues with detecting sudden traffic jamsThe issues with detecting sudden traffic jams are summarized below. First, it is necessary to use, as input data, information that is readily available and can be analyzed without incurring a high cost in communication and computation. The proposed technology collects CAN data from connected vehicles and uses the number of vehicles in each mesh as input data. It is necessary to take note of the facts that the reliability of data on the number of vehicles is low and will remain so until connected vehicles become widespread and that it is necessary to reduce the amount of computation needed for detecting a sudden traffic jam to improve real-time performance. To be able to identify roads encountering sudden traffic jams, the number of vehicles in the ordinary state (normal traffic without sudden congestion) should be learned from data on the number of vehicles in each mesh in each hour segment and the time series of that data. In doing so, it is important to take into account the facts that the ordinary state varies from road to road and that the number of vehicles changes periodically, for example, depending on the day of the week, hour of the day, and combination of the two. 4. Technology for calculating suddenness indexOur technology can quickly narrow down the spot where a sudden traffic jam is occurring. The input data it uses are the number of vehicles in each mesh, which is collected with Axispot™ [3] based on CAN data. This technology can detect the moment when the number of vehicles suddenly increases in comparison with the number of vehicles in the ordinary state. The flow for calculating SI is shown in Fig. 1. To take multiple types of periodicity into account, the technology calculates the ordinary state (hereafter, referred to as statistical information) of each mesh from various data: the average, standard deviation and time-scale reliability of the number of vehicles in each mesh, which are aggregated for the entire period, by the hour of the day, day of the week, and combination of the two (these are collectively called time granularity). Time-scale reliability is also calculated to determine, from among the results for different time granularities, which should be given high priority. This time-scale reliability is designed in such a way that it is low when the density of connected vehicles is low; thus, the number of vehicles on which information is obtained is excessively small relative to the number of lanes. Specifically, it is calculated on the basis of the number of times that the number of vehicles on which information is obtained increases above a defined threshold. When the latest number of vehicles is input, SI is calculated. The input data are the latest number of vehicles (by mesh and by time) and statistical information calculated in advance. First, the suddenness index by time granularity (SIT) is calculated by comparing the latest number of vehicles with the statistical information for each time granularity. The SIT is calculated using a method often used in outlier tests [4], as shown in Fig. 1, where C(t, m) is the number of vehicles passing through mesh m at time t, μ(T, t, m) is the mean number of vehicles at t, at m for time granularity T, and σ(T, t, m) is the standard deviation of the same. The SIT is positive if the latest number of vehicles is greater than the mean and is negative if it is smaller. The larger the standard deviation of the population, the smaller SIT is. The SIT is high when a large number of vehicles suddenly accumulate in a place where the number of vehicles is normally small and varies little.
Next, the SIT for each time granularity is multiplied by the time-scale reliability. The weighted sum of the SIT values for all time granularities is the final output, called the SI. If the value is positive, the number of vehicles is higher than usual at many high-reliability time granularities. This enables flexible selection of the mesh to study. For example, if the server that collects and processes video has sufficient surplus resources, the center and left-most meshes of the chart in the right-hand column in Fig. 1 can be selected. If it does not, only the left-most mesh, which has the highest SI, can be selected. To observe deviations from the ordinary state, it is necessary to know the ordinary state. It has been common to use a complex model, such as Auto Encoder [5], to learn the ordinary state. We adopted a different approach for the lane-specific traffic-jam-detection use case. To minimize the amount of computation and computing time required for prioritizing video-processing-based traffic-jam detection, multiple aggregation time granularities are used, and whether the number of vehicles is greater than in the ordinary state is quantified for each aggregation granularity. A benefit of this approach is that it minimizes the computation time while minimizing the negative effects when the reliability of the data is low. 5. Evaluation of accuracy and performanceSince connected vehicles are still in the early-adoption stage, we believed that a reasonable method for evaluating the accuracy and performance of the proposed technology with real data was to use Global Positioning System (GPS) logs. We calculated SI using GPS data collected from 10 taxis every 10 seconds because the occurrence of a traffic jam would reduce vehicle speeds, thus increase the number of GPS logs per unit of time. A summary of the data used is as follows:
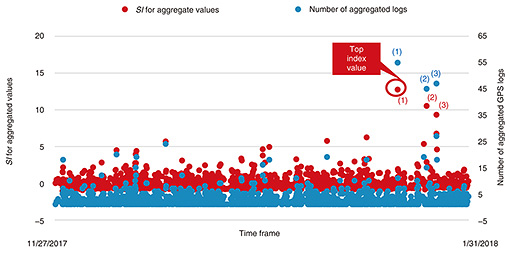
Figure 2 shows an example of the SI calculation for a specific mesh for which the highest SI was produced. The SI values are shown in red and the number of logs in blue. When the number of logs (in blue) rose suddenly at (1), the SI produced with the proposed technology (in red) also increased at (1). This indicates that the technology can be used to detect a sudden traffic jam. When traffic jams occurred repeatedly, as shown with the blue dots at (2) and (3), the SI values shown with the red dots at (2) and (3), decreased. This indicates that the use of SI gradually eliminates recurring traffic jams of similar magnitude from the target for traffic-jam detection.
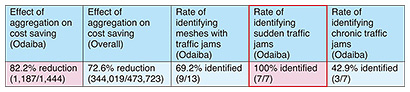
Next, we evaluated whether SI is a reliable indicator for detecting sudden traffic jams. We visually detected 121 lane-specific traffic jams in videos taken by taxis, labeled each of them as either sudden or not, and checked whether SI is effective for identifying sudden traffic jams. From the taxi data collected over a period of 66 days, we used the data from the first 33 days as training data. We then checked whether SI could identify the 7 sudden traffic jams out of the 14 traffic jams that occurred during the remaining 33 days. The results are listed in Table 1. The aggregation time at which SI became greater than 0 was considered the moment when a sudden traffic jam occurred. The table also shows that, even if 82.2% of the aggregation data taken around Odaiba (the district where the demonstration experiment was conducted) were removed, sudden traffic jams were still identified with a probability of 100%. In contrast, SI identified only 42.9% of chronic traffic jams, which are not targeted traffic jams in this use case.
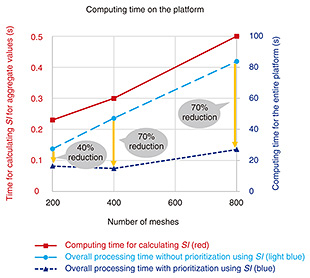
This technology was implemented on the platform used in the field trials, which is presented in another article in this issue. We evaluated the proposed technology in this setting. We examined what reduction in computation time can be achieved if the number of processed meshes (meshes for which video is processed) is reduced by 80% using SI. We examined this effect with different numbers of meshes. The results are shown in Fig. 3. As the number of meshes increased, the greater the effect of decreasing the number of processed meshes on reducing computing time. When the number of meshes was 400 or 800, the computing time decreased by 70% when using SI. However, the time required to compute SI remained as short as 0.5 seconds even with 800 meshes.
6. Future outlookWe developed a technology for calculating the suddenness index for aggregated values, which can quickly identify sudden increases in time-series data with a small amount of computation. We plan to use this technology to detect or predict sudden traffic jams on expressways caused by accidents on the basis of information about previous traffic jams on expressways. References
|
||||||||||||||