|
|||||||||||||||||||||||||||
|
|
|||||||||||||||||||||||||||
       |
Regular Articles Vol. 20, No. 8, pp. 64–71, Aug. 2022. https://doi.org/10.53829/ntr202208ra1 Business Design Support Technology to Promote Digital TransformationAbstractBusiness processes for providing services and products are becoming increasingly complicated to meet the diverse needs of customers brought on by dramatic changes in the social environment. To make improvements to these complicated processes, it is important to accurately understand and analyze business processes on the basis of comprehensive and objective data. This article introduces the business design support technology we developed that can be used immediately on-site to effectively understand and analyze the current state of business processes and the NTT technologies at the core of this technology. Keywords: DX promotion, business analysis, operations
1. Objective understanding of business processes to promote digital transformationDigital transformation (DX) has been attracting attention as a means of making business more efficient through digital technology. In the corporate and government sectors, there are two approaches to achieving DX in a variety of business processes. The first is system-oriented DX to increase the efficiency of business operations required to process a large volume of items with clear requirements through systemization. The other is site-oriented DX to increase the efficiency of infrequently occurring business operations with wide-ranging requirements. A typical example of site-oriented DX is robotic process automation (RPA)*1 to automate deskwork. Plans for achieving site-oriented DX are becoming common in many corporate and government operations through the use of RPA such as WinActor®*2 [1]. However, determining exactly where to apply RPA to gain effective improvements is extremely difficult regarding complicated business processes, even for veteran operators well acquainted with business operations. The corporate and government sectors have been searching for clues to achieving business improvements by using commercially available tools in addition to conducting on-site interviews with operators, measuring work times, etc. However, techniques such as interviews and time measurements are highly subjective, and if using commercially available tools, there is a need for detailed settings and analysis support by a specialist, which makes the hurdle to adopting such tools quite high.
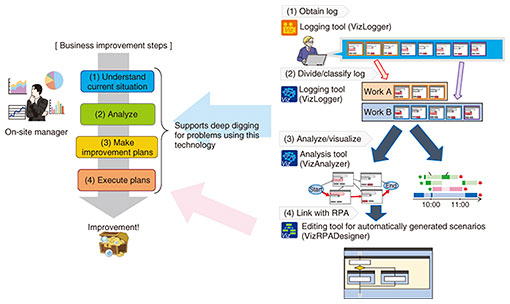
2. Business design support technologyTo solve the problems described above, NTT Network Innovation Center has developed business design support technology on the basis of technology established by NTT Access Network Service Systems Laboratories that can be put to use immediately on-site. Working to make business improvements requires the following steps: understand the current situation, analyze problems and make improvement plans, and execute plans. Business design support technology provides the following tools to put the above steps into practice immediately at the user’s site: a logging tool (VizLogger) that outputs the operations executed on a personal computer (PC) as a log file to support understanding of the current business situation; an analysis tool (VizAnalyzer) that classifies and visualizes the output log file and supports the analysis of problems and making of improvement plans; and a scenario editing tool (VizRPADesigner) that enables the editing of automatically generated scenarios of operational procedures from classification and visualization results and supports the generation of RPA scenario files and execution of improvement plans [2] (Fig. 1).
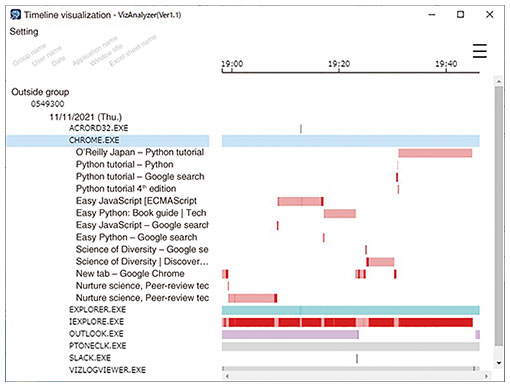
With these tools, an analyst can obtain objective and comprehensive information on the work carried out on a PC and visualize that information, enabling analysis from a variety of viewpoints. This makes it possible to extract business problems in a more effective manner than conventional techniques such as interviews and commercially available tools. These tools can be applied to not only RPA in site-oriented DX but also general business-improvement activities such as business process management*3. 2.1 Logging tool for objective and comprehensive collection of informationThe logging tool automatically records operations carried out by the user to support the understand the current situation step. As a platform supporting Windows 10 and Windows 7, this tool can be executed by simply opening it on the PC targeted for logging. A variety of browser environments such as Microsoft Edge*4, Google Chrome*5, Firefox*6, and Internet Explorer*7, are also supported. The logging tool detects user input operations, applications on the terminal screen, and changes in a window’s status. An operation carried out by the user is obtained as an operation event. The above content can be recorded and saved as a log file (in text format) in any folder. The work screen can also be saved as a captured screen when detecting an operation event to assist the analyst in understanding business operations. 2.2 Analysis tool for making improvement plansThe analysis tool analyzes the log file stored by the logging tool using automatic work-classification technology described later to support the analyze problems and make improvement plans step. This tool can use three types of visualization methods to visualize the log file: timeline visualization, process visualization, and operation-sequence visualization. (1) Timeline visualization Timeline visualization is a visualization method for analyzing usage conditions at the window level (Fig. 2).
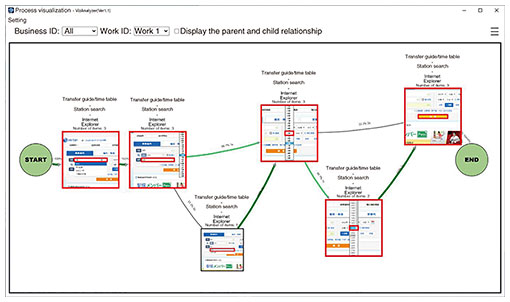
This method can display what someone is working on in a time-series manner. It can be used to intuitively discover work trends or distinctive work (work different from the norm, work taking longer than usual, etc.). This makes it possible, for example, to determine the daily operations of a certain operator and the content of that work and to compare that operator with other operators doing the same work to uncover efficient operators. In short, analyses can be conducted while switching viewpoints. (2) Process visualization Process visualization is a visualization method for analyzing process flow at a more detailed operation level such as clicks and keyboard input. This method enables overall work flow to be understood through nodes (boxes) and edges (arrows). It can be used to visualize the flow of business operations, work flow, etc. It displays the captured screen and operation location at the instant of an actual operation in a node (box), which makes it even easier to understand the work procedure. With this method, an analyst can compare the work procedure of a certain operator with that of other operators and analyze the differences or problems in those procedures (Fig. 3).
The main-flow extraction technology described later makes it possible to extract and highlight main operation flows and repeated operations from the overall work flow to support effective improvements to business. (3) Operation-sequence visualization Operation-sequence visualization is a visualization method for analyzing operation sequences for each specified unit (business, work, item, log, user, and date) in detail. This method can display rectangular objects vertically for each specified display unit. It can be used for accurately tracing and analyzing individual operations or an item’s operation order, which can be difficult to understand by timeline visualization or process visualization, or for making detailed studies of manual or RPA scenarios.
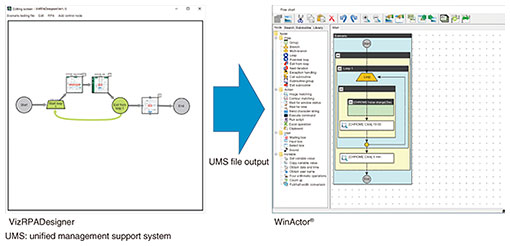
3. Editing tool for automatically generated scenarios supporting the execution of improvement plansThe editing tool for automatically generated scenarios supports the execute plans step by making the creation and editing of RPA scenarios on the basis of the results of the analysis tool easy to understand through visual means. A key feature of this tool is that it can link with the analysis and visualization results of the analysis tool so that the results of the analyze problems and make improvement plans step can be accurately reflected in RPA scenario creation and editing. Therefore, a smooth transition can be made from analyze problems and make improvement plans to execute plans (Fig. 4). This tool can also automatically generate repeated operations extracted and highlighted using main-flow extraction technology in the analysis tool as RPA scenarios.
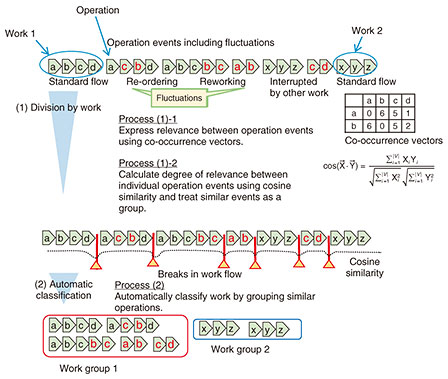
4. NTT technology featuresThe following describes two key NTT technologies making up the core of the business design support technology [3–5]. 4.1 Automatic work-classification technologyAutomatic work-classification technology is incorporated in the analysis tool. It automatically classifies operation events for each type of work while absorbing fluctuations in operations that may occur such as re-ordering, reworking, and interruptions (Fig. 5).
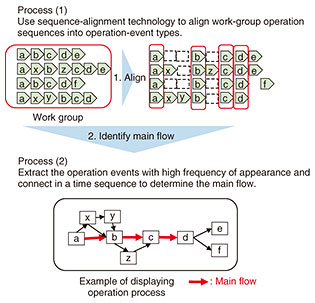
An operation event is recorded by associating a mouse-click or keyboard-input event with the graphical-user-interface component (button, textbox, etc.) targeted by that operation. It corresponds, for example, to inputting the day of a business trip and pressing an approval button. With this technology, “work” is a set of operation events, and in this example, it would specifically correspond to preparing a voucher or order slip for travel expenses. This technology focuses on the co-occurrence of consecutive operation events. It counts the number of times that operation events mutually co-occur from multiple operation events of any length and expresses each operation event as a co-occurrence vector. It also calculates the degree of relevance between operation events using cosine similarity on the basis of those co-occurrence vectors. In short, the technology can classify a log into different work groups by treating operation events with close cosine similarity as a group. A work group is defined as a set of multiple operation events corresponding to the same type of work. With this technology, it becomes possible to appropriately classify work into work groups even if fluctuations in operations should occur, such as re-ordering, reworking, and interruptions, that are bound to occur in actual work settings. 4.2 Main-flow extraction technologyMain-flow extraction technology is incorporated in process visualization of the analysis tool. It identifies main flows in which operation frequency in the processing carried out by each work group is high and for which an improvement effect can therefore be expected. This technology applies sequence-alignment technology used in genome analysis and other fields to align multiple character strings. It can take a work group classified with the automatic work-classification technology described above and align the same operation events into the same column. The technology can also extract operation events with a high frequency of appearance in common and connect the extracted operation events in a time series, thus identifying a main flow with a high improvement effect (Fig. 6).
5. Future workOur business design support technology provides tools that can support the steps of understand the current situation, analyze problems and make improvement plans, and execute plans. The commercial development of this technology has been completed, making it available for use in a variety of sites and settings. Going forward, we plan to promote its application in actual business operations through its deployment in the private sector and develop it into a business for more generalized markets. References
|
||||||||||||||||||||||||||