|
|||||||
|
|
|||||||
       |
Feature Articles: Efforts to Implement Digital Twin Computing for Creation of New Value Vol. 21, No. 4, pp. 32–37, Apr. 2023. https://doi.org/10.53829/ntr202304fa4 Digital Twins for Streamlining Road-traffic FlowAbstractWe are studying the use of digital twins to optimize traffic flow so that traffic congestion will not occur. To reproduce current real-world traffic flow and predict future traffic flow using digital twins requires traffic-demand data with fine granularity in time and space. Due to recent increasing activity to create smart cities, we can now obtain cross-sectional traffic-volume data for short time intervals of five minutes, but such measurements are still only being taken at a relatively small number of locations, so spatial granularity is large. In this article, we introduce our OD (origin-destination)-estimation technology that uses cross-sectional traffic volume on arterial roads to interpolate such fragmented cross-sectional traffic data to generate realistic traffic-demand data. Keywords: Exploring Engine for the Future Society, digital twin, traffic-flow simulation
1. Smart city and digital twin technologySmart city initiatives have become more active as measures to address urban issues such as the rapidly aging population and increasingly frequent natural disasters, and digital twin technology has been attracting attention for implementing such initiatives. This is because it reproduces real-world conditions in digital space, based on detailed geospatial and sensor data, and makes it possible to conduct social experiments and simulations that would be difficult or impossible to do in the real world. For example, it can be used to simulate changing traffic conditions when poor weather causes flooding and blocked roadways, or to evaluate the effects of changing the shape or placement of buildings on weather factors such as wind. We are using digital twin technology to create a highly accurate representation of human activity in society and conducting research and development on an “Exploring Engine for the Future Society,” which provides a mechanism for exploring possible futures by iteratively making changes to human behaviors. 2. The difficulty of reproducing traffic flowTraffic is one essential element that must be simulated using digital twins of human activity. Traffic-flow simulation on a digital twin can simulate traffic on the actual roads of a town on the basis of current data from sensors in the real world and can be used to evaluate measures to address general traffic issues such as draft or preliminary measures to mitigate congestion and optimizing routes for on-demand bus operation. To reproduce the flow of vehicles on a wide-area road network such as a city requires three essential elements: map data, traffic-demand data, and vehicle models. However, very few comprehensive datasets from actual society exist for any of these, and it is very difficult to obtain true values. Traffic-demand data has three aspects: survey frequency, roadways covered, and vehicles covered; and there are no datasets that satisfy all three. Thus, all available data are difficult to use for digital twins, which need to reproduce the movements of each vehicle with fine granularity in space and time. As such, we have developed origin-destination (OD)-estimation technology to estimate traffic demand on the basis of cross-sectional traffic-volume*1 data and estimate traffic volume on segments where traffic counters are not installed. The available five-minute cross-sectional traffic-volume data satisfy the survey-frequency and vehicle-type aspects but only covers some roadways, so our OD-estimation technology compensates from the perspective of roadways covered.
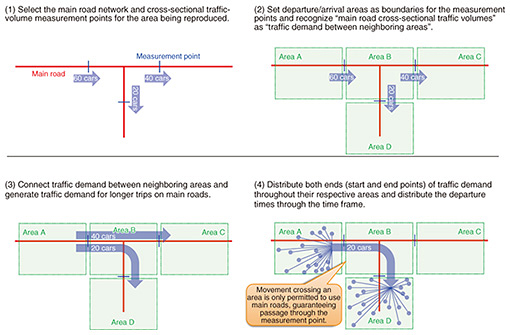
3. Estimating traffic demand on basis of cross-sectional traffic-volume dataTraffic-demand estimation had generally been done with a four-step model*2, using results from person-trip studies and surveys to obtain data on the start, end, and route-taken by moving people and vehicles. Person-trip surveys aggregate the number of people (or vehicles) moving per unit time for pairs of starting and ending locations and conducted every five to ten years by local and national governments. Although it has the advantage of fine spatial granularity, it is only an average value for a specific day of the week, since the survey is conducted once every 5 to 10 years, and does not take into account variations related to seasons and days of the week. Thus, we focused on using cross-sectional traffic-volume data with five-minute granularity collected by local police agencies using traffic counters installed on major roadways throughout Japan. These counters are installed at relatively few locations so the spatial granularity is coarse, but the spatial data can be interpolated between neighboring installations, making it possible to estimate the movements of vehicles to some extent. With our OD-estimation technology, we first extract the structure of the main road network and the placement of points where cross-sectional traffic volume is measured in the area being reproduced (Fig. 1(1)). We define vehicle departure and arrival areas such as Area A and Area B as the boundaries for these measurement points and interpret the cross-sectional traffic volume on main roadways as the traffic demand between adjacent areas (Fig. 1(2)). We then generate traffic demand for longer trips by concatenating traffic demand for very short trips between adjacent areas while giving priority to routes that run along specific main roads (Fig. 1(3)). Next, we distribute the traffic demand at both departure and arrival ends over the roads throughout the respective areas (Fig. 1(4)). This enables us to reconcile the cross-sectional traffic volumes at all measurement points and generate real travelling routes on main roadways, including left and right turns. We are also able to improve the accuracy of interpolating spatial information by adjusting distribution conditions for departure and arrival points in accordance with factors such as the location and scale of large commercial facilities and differences in day and night population distributions. This technology has enabled us to estimate traffic demand at fine time granularity of five-minute intervals and space granularity of several square kilometers.
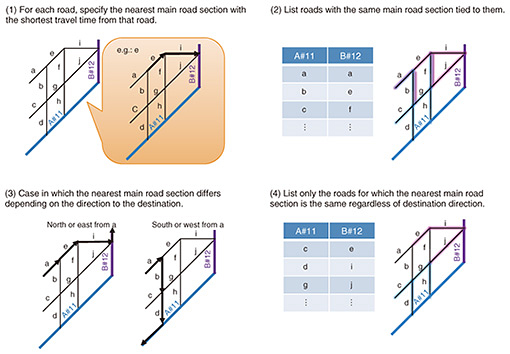
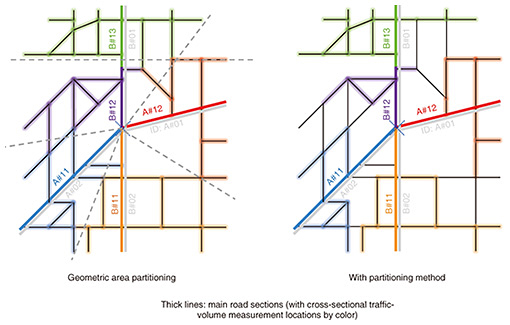
4. Setting departure and arrival areasWe now describe setting the departure and arrival areas (Fig. 1(2)) in more detail. We define departure and arrival areas to correspond to sections of the main roadways, segmented by the points where cross-sectional traffic volumes are measured. To consider traffic originating and arriving at smaller roads surrounding the main roadways, we select roads connected to each of the main-road sections. At first glance, it may seem that defining areas geometrically would be good, but considering how geography is divided by changing terrain, rivers, roadways, one-way roads, and speed restrictions; however, this produces areas that do not seem to surround routes naturally taken by vehicles. Intuitively, we want to choose roads that are closest to that section of the main road, so we developed a method that partitions areas from the perspective of travel time using road-map data. This method identifies, for each road, the nearest main road section with the shortest travel time from that road using the traffic flow simulator’s route-search function (Fig. 2(1)). Finally, a list of roads identified as the same main road section is compiled and linked to that section to define departure and arrival areas (Fig. 2(2)). There will still be cases in which the main road sections are different depending on the direction of the destination (Fig. 2(3)). In such cases, movement straddling areas can occur on back streets and can be separate from traffic volumes on main roads, so we solve this by only listing roads that are judged to be the nearest to the same main road, no matter what destination is selected (Fig. 2(4)). Accordingly, we can guarantee passing the specified measurement point by simply specifying the departure and arrival areas without specifying a route. The roads that are not colored in the right image of Fig. 3 are those excluded when making the list using this partitioning method because there are multiple main roads nearby, so the main road taken will differ depending on the direction to the destination. The computational cost for this method is O(n) with respect to the number of roads, n. This is much less than a brute-force approach, which would be O(n2). By selecting departure and arrival areas in this way, we can avoid having main road traffic volumes straying too far from real values, even when converting to traffic demand between areas.
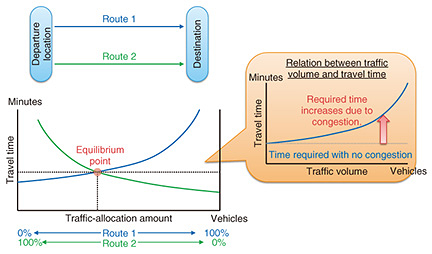
5. Estimating traffic volumes where there are no traffic counters installedOur OD-estimation technology can generate real traffic demand, but it is only applicable to sections that have traffic counters installed. To expand the applicable range to include areas without traffic counters, we introduced the idea of equilibrium assignment. Equilibrium assignment is an approach that focuses on the travel time required when allocating numbers of vehicles to various roads for routes between locations. When there are multiple routes connecting a departure and an arrival point, drivers generally try to select a route to minimize the travel time required to move between the points. We also assume that drivers always have complete information regarding the available routes. Travel time depends on the amount of traffic, so it will vary depending on the route that each driver selects. For example, if many drivers select route 1, traffic on route 1 will increase, causing congestion and increasing the time required to move between points, but since route 2 is being selected less often than route 1, its traffic and travel time will decrease on route 2. This relationship between traffic volume and travel time has been formalized, and equilibrium can be reached through balance of supply and demand. Therefore, if drivers have sufficient information, the travel time on all used routes will equalize, and be less than unused routes, or converge to be mostly equal (Fig. 4).
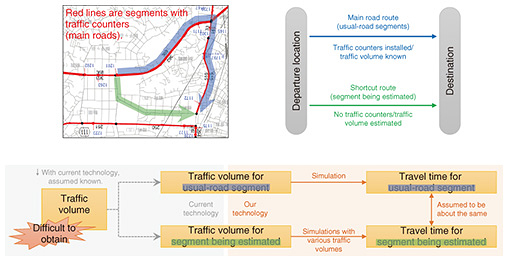
The difference in function between our technology and current technology is shown in Fig. 5. We describe the process using an example of main roads and shortcuts that connect the main roads. We assume that traffic counters are installed on the main roads but not on the short-cut roads. We use this approach to estimate the traffic volume on the shortcut.
First, we find the short-cut route (green in Fig. 5) and the usual route using main roads (blue). We then estimate the travel time for both routes. We have traffic-volume data from traffic counters on the main-roadway route, so these data can be used to simulate traffic flow and determine the travel time. However, there are no traffic-flow data for the shortcuts, so various assumptions must be made to simulate traffic flow and determine the travel time. Even using the same route, travel time will depend on the traffic volumes, so we expect the computed travel time to differ depending on the assumed traffic volume. In this case, returning to the equilibrium assignment idea, the travel time for both routes will naturally be the same. Thus, we can use the traffic volume that would yield the same travel time as the main-roadway route. With this approach, without using total traffic as with current technology, we expect to extend our OD-estimation technology to segments where traffic counters are not installed. 6. Future prospectsWe introduced technology for generating realistic traffic-demand data as needed to recreate past traffic conditions using cross-sectional traffic-volume data. To increase the accuracy of reproduced traffic conditions and predict future traffic conditions using current conditions as a starting point, we will study ways to use vehicle-probe data from connected cars, which are starting to become more common. Vehicle-probe data can be obtained more closely to real-time than can cross-sectional traffic-volume data. Such data are easier to process and can provide more details about vehicle behavior, such as the route and travel time, so they are expected to be an essential data source for recreating digital twins in real time. Connected cars are still just beginning to permeate society, so there is not much data yet, and it is still difficult to get an overall perspective on traffic conditions. Therefore, we are also studying ways to use the behavior of connected cars to estimate the behavior of non-connected cars. At NTT, we will continue to develop traffic-flow digital-twin-generation technology by integrating technologies to estimate, predict, and reproduce traffic flows. |
||||||