|
|||||||||
|
|
|||||||||
       |
Practical Field Information about Telecommunication Technologies Vol. 22, No. 2, pp. 54–57, Feb. 2024. https://doi.org/10.53829/ntr202402pf1 Optical Loss Prediction Tool 1.0 toward Enabling Preventive Maintenance of Optical Fiber CablesAbstractTechnical Assistance and Support Center, NTT EAST developed the Optical Loss Prediction Tool 1.0 for predicting transmission loss of optical fibers. This article presents an overview and the functions of this tool. This is the eightieth article in a series on telecommunication technologies. Keywords: OTDR, transmission loss, loss prediction
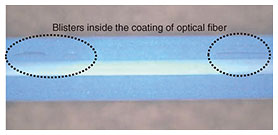
1. IntroductionOptical fiber cables are deployed in diverse environments, such as urban and mountainous areas, and play a role of a social infrastructure supporting not just information and communication services but also various social activities. Transmission loss of optical fibers in the cable may increase due to age-related deterioration caused by the environmental conditions under which the cable is deployed. To maintain communication quality through optical fiber cables as a social infrastructure, it is important to regularly monitor transmission loss of the optical fibers and preventively take necessary maintenance, such as cable replacement, before a problem occurs. Technical Assistance and Support Center (TASC), NTT EAST developed the Optical Loss Prediction Tool 1.0 for predicting the transmission loss of optical fibers from periodically conducted and stored optical measurement data. This article presents an overview and the functions of this tool. 2. Development backgroundOptical fiber cables may deteriorate over time due to the environmental conditions, which can cause an increase in transmission loss [1]. For example, in underground optical fiber cables that have been laid in a humid environment for an extended period, blisters may form inside the coating of the optical fibers, as shown in Fig. 1. In such optical fibers, the continuous application of multiple invisibly small bending (microbending) causes excessive transmission loss. Even small locally, the transmission loss accumulated over long distance (over hundreds of meters to several kilometers) can increase so much that service cannot be provided, when microbending occurs. To maintain optical fiber cables in good condition, it is important to periodically conduct tests to determine the state of transmission loss and take preventive measures, such as replacing cables, before a problem occurs.
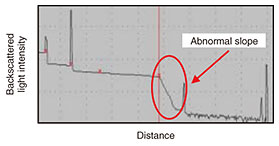
An optical time domain reflectometry (OTDR) is generally used to determine the condition of optical fiber cables. An OTDR uses pulsed light as a test light injected into an optical fiber and measures the backscattered light and reflected light. The round-trip delay of the backscattered or reflected light is proportional to the distance to the scattering or reflection point in the optical fiber; therefore, the transmission state along the length of the optical fiber cable can be estimated by acquiring the intensity of the backscattered or reflected light as a function of time [2]. Figure 2 shows that in a cable section where transmission loss has increased due to cable aging, etc., the slope of the waveform measured with an OTDR, which is the backscattered light intensity change with respect to distance, increases abnormally. Therefore, by analyzing the slope of the waveform with respect to distance, it is possible to determine the condition of transmission loss.
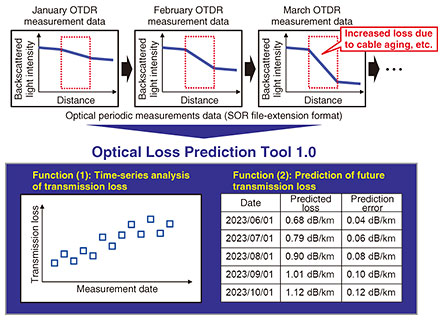
NTT EAST Group conducts monthly optical measurements on optical fiber cables in optical access networks using an OTDR. However, these periodic OTDR measurements only confirm the presence or absence of abnormalities at the time of measurement, and there is no method for detecting abnormalities before they become apparent. If an abnormality is detected during periodic OTDR measurements and the abnormal optical fiber cable must be renewed, it can take several months to a year from design to completion of installation. Therefore, it might be difficult to secure assignable fibers if the abnormality is addressed after it becomes apparent. Responding to the above issues, TASC developed the Optical Loss Prediction Tool 1.0 to identify transmission loss abnormalities in advance. This tool uses periodically conducted and stored optical measurement data to analyze time-series changes in past transmission loss and enables prediction of future transmission loss. 3. Overview of Optical Loss Prediction Tool 1.0Figure 3 shows an overview of the Optical Loss Prediction Tool 1.0. The tool has two main functions: (1) time-series analysis of transmission loss and (2) prediction of future transmission loss. The following sections explain each function.
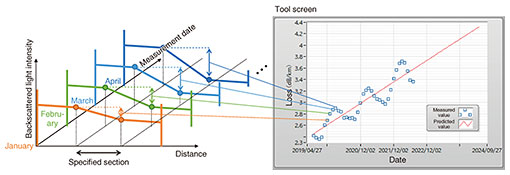
3.1 Time-series analysis of transmission lossThe tool’s first function is to visualize time-series changes in transmission loss in any cable section. To use this function, the folder containing optical periodic measurement data is specified on the input screen. The tool then loads all optical periodic measurement data from the specified folder at once. The loaded measurement data, which is compliant with the Standard OTDR Record (SOR) data format [3], includes the backscattered light intensity and distance information measured using an OTDR, as well as the measurement date. When analyzing transmission loss, the distance information for the cable section is specified. The transmission loss values are then automatically analyzed for all loaded SOR extension data by calculating the backscattered-light-intensity changes in the cable section on the basis of the specified distance information. These values are associated with the date of measurement recorded in each SOR extension data, and displayed in a graph arranged in order of measurement date, as shown in Fig. 4. This graphical visualization of time-series changes in transmission loss enables us to see the degradation trend of transmission loss in the specified section.
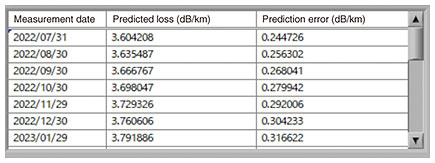
3.2 Prediction of future transmission lossThe tool’s second function is to predict future transmission loss in the specified cable section. This function uses the analyzed time-series data mentioned in Section 3.1 as training data for transmission loss prediction. Transmission loss prediction is carried out by applying a regression analysis to the time-series data and extrapolating the obtained regression line to the specified prediction date, as shown with the red line in Fig. 4. The predicted losses are listed next to the specified prediction date, as shown in Fig. 5, in a manner that makes it possible to quantitatively understand the predicted increase in transmission loss. As also shown in Fig. 5, the predicted values of transmission losses as well as estimated prediction errors are displayed as a list up to the specified prediction month, enabling a quantitative understanding of transmission loss deterioration prediction. The prediction errors, which are automatically estimated on the basis of the specified confidence coefficient (probability that the prediction value will fall within the error range) and prediction date, are displayed together with the prediction values in this list box. This function makes it possible to determine the prediction value of future transmission loss and error range, which can be useful in planning cable renewals.
4. ConclusionThis article introduced a tool for predicting future transmission loss in optical fiber cables. We believe that this tool will help prevent failures caused by changes in transmission loss due to age-related deterioration, etc., and contribute to the planned renewal of cables. Toward practical use for cable maintenance, we are currently discussing the utilization method of this tool with the relevant departments of NTT EAST and NTT WEST. We will also improve our prediction accuracy by incorporating machine learning and other methods into this tool. The Access Network Engineering Group in TASC offers technical support to resolve challenging access facility failures that occur in the field throughout Japan. We will continue to contribute to field troubleshooting and develop tools that enhance technical skills and efficiency in the field by leveraging the expertise acquired from technical support and the knowledge gained through the investigation of the causes of failures. References
|
||||||||