|
|||||||
|
|
|||||||
       |
Feature Articles: Urban DTC for Creating Optimized Smart Cities Attentive to the Individual Vol. 22, No. 5, pp. 94–101, May 2024. https://doi.org/10.53829/ntr202405fa12 Improving Efficiency of Agricultural-product Distribution by Using a Virtual MarketAbstractTo improve the efficiency of agricultural-product distribution, NTT is creating a virtual market that can optimize commercial distribution and logistics on a nationwide scale by consolidating information on the supply and demand of agricultural products. This virtual market will help solve the so-called “2024 problem” facing the logistics industry due to the enforcement of new overtime regulations and ease labor shortages in fields related to the distribution of agricultural products, improve the economic effects of distribution by reducing time and costs, and reduce the environmental burden of distribution by reducing greenhouse-gas emissions and food loss. Keywords: agricultural-product distribution, virtual market, 2024 problem
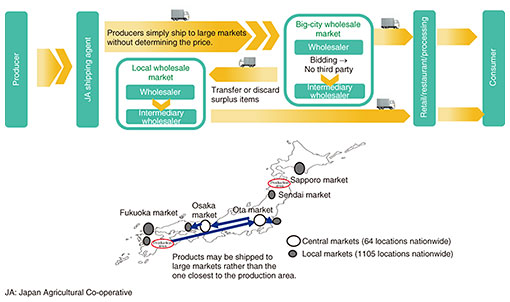
1. Current status of agricultural-product distributionThe current status of agricultural-product distribution through markets in Japan is shown in Fig. 1. About 80% of fruits and vegetables are currently traded through wholesale markets [1]. Most of that produce is shipped to markets in large cities such as Tokyo and Osaka. However, from the perspective of market principles, if an excess of agricultural products occurs, prices will fall. The problem is that the shipments concentrate in the big-city markets; thus, local markets are unable to gather products. The resulting surpluses in the big-city markets are transferred to the local markets, but some products are discarded because they are no longer fresh. Producers are unable to determine the demand at each market, and that inability results in wasted delivery due to shipping to distant markets even though demand is stronger at nearby markets.
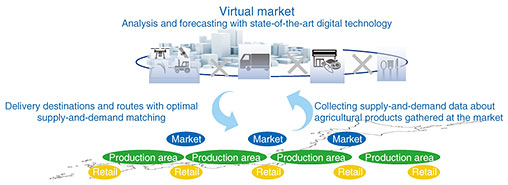
In fact, vegetables produced in Kyushu are shipped to Tokyo, while the same vegetables produced in the northern Kanto region (nearer to Tokyo than Kyushu) are shipped to Osaka (nearer to Kyushu). Since retailers do not know the shipment volume that will arrive at the market, they are unable to decide what amounts of goods to buy until just before they arrive; as a result, the retailers may have to change their processing and sales plans in accordance with the incoming volume that arrive at the market. In addition to the above issues, the digitalization of operations has not progressed in various areas related to the agricultural-product distribution, which makes it difficult to comprehend the total volume of supply and demand, delivery routes, and other aspects of the overall distribution process. In these situations, the “2024 problem” is also having an impact on the distribution of agricultural products. The “2024 logistics problem” (2024 issue) is the collective term for issues arising from the imposition of limits on the working hours of drivers in the logistics sector. As the daily mileage per truck driver decreases and it becomes more difficult to transport products over long distances, distribution over long distances will become more difficult in some production areas. The increasing cost of transportation in production areas near large cities will also require more-efficient transportation in terms of shorter delivery distances and times. 2. The future we want: the virtual marketTo solve the above problems concerning agricultural-product distribution, we are building a virtual market, as shown in Fig. 2. This virtual market uses Digital Twin Computing (DTC)* to (i) predict future supply and demand from nationwide data on agricultural-product distribution and (ii) complete buying and selling in a virtual space before agricultural products are transported to the market.
In the virtual market, the commercial flow, including operations such as supply-and-demand matching, is completed while logistics delivers products via optimal routes on the basis of the results of matchings in the virtual market. By considering the most-suitable place to send agricultural products before shipping them from the production area, the virtual market makes it possible to (i) prevent transfers of products due to imbalances in supply and demand between markets and (ii) consolidate agricultural products from nearby production areas and other items in a manner that will enable delivery with no waste. The following list contains example values that the virtual market can provide to various stakeholders. (1) Producers: By adjusting the supply-and-demand balance through forecasting, it becomes possible to avoid price decreases due to oversupply. By shipping products to closer markets, shipping costs and wasted agricultural produce can be reduced and income will thus increase by providing fresh, high-value vegetables. (2) Wholesale market: By adjusting the supply-and-demand balance through forecasting, costs, such as transferring unsold items and supplying from neighboring markets due to product shortages, can be reduced. Digitizing analog transactions will also help mitigate labor shortages. (3) Logistics providers: The delivery distance can be reduced by optimizing the route. Forecasting of shipping volume enables more-accurate delivery planning and efficient arrangement of personnel, trucks, etc. (4) Intermediary wholesalers and retailers: By being able to predict the volume of incoming stocks, it will be possible to arrange in advance for the materials and personnel necessary for processing agricultural products. (5) Consumers: The time required for distribution is shortened, and consumers will have access to fresher produce than ever before.
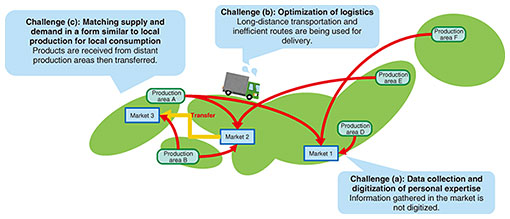
3. Challenges and approaches concerning the virtual marketImplementation of the virtual market faces three major challenges, each of which—along with our strategies—is introduced below and illustrated in Fig. 3.
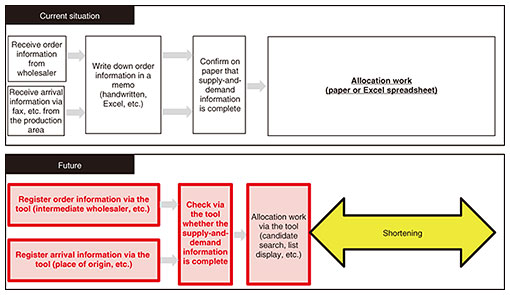
3.1 Challenge (a): Data collection and digitization of expertiseMany organizations involved in the distribution of agricultural products have not yet digitized their operations. Among the stakeholders involved in the distribution of agricultural products, such as producers, wholesale markets, and intermediary wholesalers, information is fragmented due to the predominance of analog transactions based on telephone calls, fax, and paper, and those types of transactions involve a great deal of wasted time and labor. The current lack of digitization of data on transactions makes it difficult to collect and analyze information. Furthermore, many of the operations involved in agricultural-products assignment have become individualized and the expertise has become tacit knowledge of individuals. In preparation for future transactions in the virtual market, it is necessary to (i) establish a data-collection mechanism while digitizing business operations and (ii) accumulate and analyze the collected data so that future forecasts and business expertise, which is tacit knowledge, can be reproduced digitally. 3.2 Challenge (b): Optimization of logisticsAgricultural products produced in local areas are currently transported over long distances to wholesale markets in large cities. However, in response to the 2024 problem, it will be necessary to shorten the distance that those products can be transported at one time and the time it takes to load and unload them. Therefore, each production area needs to transport agricultural products gathered at collection points to their destinations in the optimal manner. The optimum solution to the transport problem must account for a variety of factors such as travel routes, transit points, mixable items that can be transported in the same truck, and time required for loading and unloading produce. 3.3 Challenge (c): Matching supply and demand in a form similar to local production for local consumptionEven if information is digitized and collected in the virtual market, optimizing delivery without changing the conventional shipping destination and digitizing supply-and-demand matching will not alleviate the concentration of shipments to major urban markets. The concentration of shipments to big-city markets will continue, and waste will remain because surplus agricultural products will still be transferred between markets or shipped far away. The optimal supply-and-demand matching that we want to achieve using the virtual market is to match supply and demand in consumption areas close to the production area in a manner similar to local production for local consumption. To achieve this goal, it is necessary to (i) collect information not only from one market but also from multiple markets on the virtual market, and (ii) achieve optimal supply-and-demand matching by taking into account information on supply-and-demand volumes and delivery costs for the multiple markets. 4. Current efforts in implementing the virtual marketTo implement the virtual market, we are working with the Shinmei Group, a major wholesaler of agricultural products with multiple fruit-and-vegetable wholesale markets within its group, to examine and address each of the above challenges step by step. We have been conducting a demonstration experiment on challenge (a), namely, data collection and digitization of expertise. In this experiment, we are working on the digitization of information on orders (demand) and supply gathered in the market and operations relating to the matching of supply and demand. The latter issue is referred to as product allocation. 4.1 Overall picture of digital distributionThe current and future work flows of the distribution system are shown in Fig. 4. Regarding the current work flow, information about incoming products and orders from intermediary wholesalers are exchanged by phone, fax, etc. The information about supply and demand, which comes in various forms, is compiled by the persons in charge of product allocation in the form of paper memos, Excel spreadsheets, or other methods to which they are accustomed. At that time, supply and demand is not adjusted in advance, so not only the supply and demand in accordance with production area and class/grade but also the total amounts of supply and demand do not match exactly. Therefore, for each individual order or intermediary wholesaler, the extent to which differences in production area, grade/class, and quantity are acceptable is determined on the basis of the expertise of the persons in charge of product allocation (which is not written on order forms), and products are distributed in accordance with the situation at the time. Wholesale markets have a principle of “full acceptance,” namely, all agricultural products that arrive must be accepted and sold due to regulations. Therefore, they look for intermediary wholesalers who are willing to accept additional quantity, even if the quantity is larger than ordered. All incoming products are manually allocated to orders.
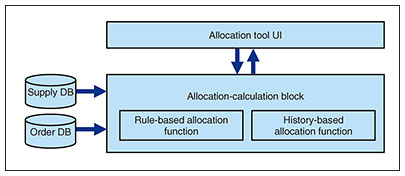
After the digitalization of the distribution system, the supply-and-demand information is consolidated on a tool, which shows the status of supply and demand clearly. Instead of having to manually search for orders for product allocation one by one, the tool supports users searching for candidates and creating an allocation plan. The tool enables users to link orders and products and search for candidates with various conditions via a simple operation. We are aiming for automatic allocation; that is, an allocation plan is created at the touch of a button on the basis of aggregated supply-and-demand information. This capability will significantly reduce work time, even if a part of the allocation plan must be manually corrected. 4.2 Functional blocks of the allocation toolThe product allocation tool consists of the functional blocks shown in Fig. 5. The flow of using this tool consists of the following four steps.
(1) Supply information from production areas is registered in the supply database, and order information from intermediary wholesalers is registered in the order database. (2) The allocation-calculation block invokes the rule-based and history-based allocation functions to create an allocation plan in accordance with the registered supply information and order information. (3) The created allocation plan is checked on the user interface (UI), and the person in charge of allocation makes corrections manually as necessary. (4) Finally, confirmed distribution results are collected and analyzed using the history-based allocation function, and the learned content is reflected in the next generation of automatic allocation plans. 4.3 Requirements for the allocation-calculation blockA requirement for automatic allocation is to reflect the various judgments made by the person in charge of allocation during actual work. Examples judgments made by the person in charge of allocation include the following:
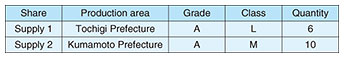
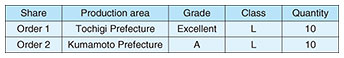
These matters should be properly handled with the tool. The person in charge of allocation makes decisions flexibly in accordance with various circumstances, such as variations in supply due to the time of year or weather conditions or orders with different conditions such as bargain sales or food/gourmet fairs. The conditions that must be taken into account depend on the intermediary wholesalers. We are investigating an automatic-allocation method that can appropriately reflect the various conditions and assumptions taken into account by the person in charge of allocation. 4.4 Overview of algorithm for automatic allocationThe order and supply are first compared by assigning similar attributes to the order and supply. An example of this allocation procedure is shown in Tables 1 and 2, respectively. Orders that must be fulfilled according to quantity have a “quantity required” flag attached to them to indicate that condition. For example, if “order 1” has that flag, for “order 1,” the algorithm will output an allocation result that satisfies the order quantity of “10.” Next, the example of “order 1” is used to illustrate that the person in charge of allocation can consider different decision criteria, such as whether the matching is prioritizing production areas or satisfying quantity.
(1) When products are allocated with priority given to the production area: “order 1” is assigned to “supply 1,” which does not meet the quantity condition but meets the production-area condition, and the quantity is set to “6.” (2) When products are allocated with priority given to meeting quantity: “order 1” is assigned to “supply 2,” which is from a different production area but satisfies the quantity condition, and the quantity is set to “10.” (3) When products are allocated according to an order with a required-quantity flag and priority is given to the production area: “order 1” is assigned to “supply 1,” which satisfies the production-area condition, and the quantity is set to “6.” If this does not satisfy the required quantity condition, “supply 2” is further assigned even if the production is in a different area from the condition. By assigning a quantity of “4” to “supply 2,” the quantity is set to “10.” Therefore, automatic allocation makes it possible to output allocation results according to various criteria (tacit knowledge) considered by the person in charge of allocation. To create the algorithm for supply-and-demand matching with such data, in addition to expressing the conditions as rules as described above, we are investigating a method of expressing the correctness of matching as a parameter and using this method to optimize the matching. The history-based allocation function is also used to digitize the expertise possessed by persons in charge of allocation. This function accumulates and learns whether the person in charge of allocation used the allocation plan created by the tool as is or modified it and if they modified it, how they modified it. We are trying to use this function to learn the expertise of the person in charge of allocation, which cannot be expressed in a rule-based manner, and to output the results of allocation in consideration of that expertise. 5. Future developmentsThe digitalization of the allocation system is only the first step toward implementing the virtual market. This initiative will change the conventional agricultural-product distribution system and create a new system that separates the products and commercial flow. To create the virtual market, therefore, the understanding and cooperation of all stakeholders will be required. In addition to technology, other issues concerning the virtual market remain to be resolved; regardless, to provide better value to the many people involved, from producers to consumers, we are committed to making significant changes in the distribution of agricultural products in Japan through the virtual market. Reference
|
||||||