|
|||||
|
|
|||||
       |
Feature Articles: Urban DTC for Creating Optimized Smart Cities Attentive to the Individual Vol. 22, No. 5, pp. 71–77, May 2024. https://doi.org/10.53829/ntr202405fa9 Using Smart-store Behavior Data to Optimize Sales PromotionAbstractImplementation of information and communication technology in retail stores is advancing, with self-scan shops using smart carts and others that enable “empty-handed” purchasing without even going to a register. In such shops, we can obtain point-of-sale data including customer identifiers and behavior data such as movement flows within the store, and that enables us to understand a customer’s behavior leading to a purchase. This was not possible with conventional shops. This article introduces an initiative that uses such data to create a digital twin of a store, which is used for sales promotion or more efficient operations. Keywords: smart store, marketing, flow classification
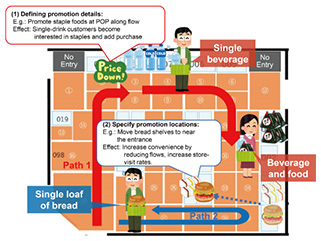
1. Smart store expansion and store digital twinsInformation and communication technology (ICT) is being deployed in brick-and-mortar retail establishments, such as convenience stores and supermarkets, to improve the shopping experience for customers, reduce personnel costs, or increase earnings. For example, in December 2016, Amazon created a stir when it opened the first Amazon Go store in Seattle, Washington. The store uses cameras and sensors to recognize customers and products automatically, enabling customers to complete purchases by simply picking up products and leaving the store. Following in the footsteps of Amazon Go, Shanghai company, Cloudpick, developed a similar retail system, which is being used to develop more than 200 stores in 11 countries around the world, including Japan, USA, Germany, France, Singapore, and South Korea. San Francisco, California company, Zippin, is also developing about ten stores, mainly in the USA. Another Seattle company, AiFi, is launching a system that does not use sensors and determines purchases using only image recognition. In Japan, major convenience store chains established trial stores between 2020 and 2021. In particular, Family Mart quickly established their system in collaboration with TOUCH TO GO Co. Inc., and is steadily adding stores using the system. In the supermarket domain, Trial Holdings began deploying a smart cart (RegiCart) system that is able to scan products in February 2018. Aeon also started its “RegiGo” service in March 2020, implementing smart carts with a dedicated terminal, and as of 2023, it is expanding this system to approximately 200 stores throughout Japan. We refer to retail stores that are implementing ICT in these ways as smart stores. In addition to collecting customer identifier (ID) and purchase data (ID-point-of-sales (POS) data), these smart stores are able to gather data on the position of each customer from when they enter to when they leave the store (“flow data”), and depending on the store, how much time they spent at each product shelf and what products they pick up and perhaps replace on the shelves (“reaching data”). Thus, data on both what was purchased and the process of making the purchase can be obtained. These data can be used to create a store digital twin (DT) to estimate each customer’s needs and preferences, and their behavior and purchases in the store can be predicted, to target sales promotion more accurately to each customer or improve efficiency in store operation. This article introduces a store DT initiative within a smart store. We first describe the types and characteristics of data that can be obtained in a smart store. We then discuss an analysis we conducted of problems and solutions when proposing measures more targeted to individual customers and other store improvements. We then introduce a method for classifying customer behavior using ID-POS and flow data and an initiative to propose measures that combine it with customer information for automatically selecting customer and purchase groups (segments) that have potential for increased sales. 2. Types and characteristics of data obtainable in a smart storeThere are various types of customer-purchasing-behavior data that can be obtained in a smart store. The three main types are the following. (1) ID-POS data: ID-POS data refer to ordinary purchase (POS) data that are collected using a cash register and linked with a customer ID. The customer ID can be obtained from a smartphone app when entering the store, through face recognition or other means and associated with a purchase, or by presenting a membership card or using points when making a purchase. The POS data generally include the type and quantity of a purchased product, the price, any discount or coupon used, and payment information. ID-POS data follow the sequence of a particular customer’s purchases through time, so they can be used to analyze their purchase history and preferences. For example, the data can show what type of products they buy often, when they buy them, how much they buy, and what combinations of products they buy. This can be used to present products and services suited to that particular customer or facilitate cross-selling or up-selling measures. (2) Flow data: Flow data refer to the record of where and how the customer moved through the store, expressed for example as a time sequence of coordinates within the store. Flow data can be captured using infrared or RGB cameras and used to analyze customers’ purchasing process and movement patterns. The data can show, for example, the order in which a customer navigates the store or which product shelves they stop in front of and for how long. This can enable understanding of customers’ interests and needs, optimization of store layout and product displays, or real-time product and service suggestions. (3) Reaching-behavior data: Reaching-behavior data refer to recording of behaviors when customers pick up a product and possibly return it to the shelf. Most reaching-behavior data are obtained using data from weight-sensors on the shelves and can be used to analyze customers’ desire to purchase or their decisiveness. For example, the data can indicate which products the customer reaches for, the probability that they will purchase it if they have picked it up, or what products they are comparing it with. This can be used to improve product pricing or placement or provide coupons or points to promote purchases. 3. Issues when suggesting measures targeting individual customersThere has been no way to record purchasing behavior of customers in a brick-and-mortar store, and analysis could not go beyond understanding the overall buyer demographic for each product from POS data using artificial intelligence (AI) cameras to understand which areas are crowded or the age or gender distribution of customers in each time block. By combining these with the ID-POS and flow data available in a smart store, it is possible to understand the process leading to a purchase for each customer and each purchase. The following are issues that could arise with such systems. (1) Too many patterns in purchase-behavior data: There are many variations in the processes by which customers purchase a particular product. Even considering a single path taken, there are many non-specific elements, such as exploring to find the product, sudden path changes, and time spent at the shelves deciding on a purchase. A mechanism able to extract and process the main patterns from this complex data is needed. (2) Segment granularity considering measures that can be taken in a physical store: Compared with online stores, ways to intervene with a customer in a physical store are limited. There are measures that can be taken on an individual basis, such as using coupons or notifying an app, but there are many measures that affect the entire store, such as changing the product or location or promoting products using signage. As such, even for one-to-one marketing, it is important to separate segments with granularity that is suited to planning some physical measures. (3) Discovering segments where intervention can be effective and estimating the effect of the measure: Data obtainable in a smart store span many branches, so a huge amount of work is required to manually select segments that can be addressed with a measure, with all their various combinations of attributes. However, very little data have been recorded regarding the effects of sales-promotion measures taken in physical stores, and an approach using machine learning to find sets of measures that are effective would require large amounts of training data and be extremely difficult. We are conducting research and development on the following technologies to address the above issues. For issue (1), we are developing an in-store behavior-classification technology that executes clustering on complex customer behavior and purchasing patterns, accounting for constraints in a physical store, and presents them with a suitable granularity. For issue (2), we are developing a technology to combine customer, purchase, and behavior data available in a smart store, automatically find segments with potential for intervention, estimate the effect of measures taken on them, and propose such measures. 4. Technology to classify movement in retail stores to promote salesIn-store sales promotions to prompt customers to make purchases in the store are important for increasing sales. Various options are available, such as optimizing the store layout and product displays and suggesting products and services using digital signage or point-of-purchase (POP) materials. Store managers must understand the behavior of customers in the store to select and implement the best from among these in-store promotion options. Segmenting the flows of customers and their purchasing tendencies in the store and presenting them can enable the store manager to plan methods and scenarios for sales promotions targeted to each segment. Figure 1 shows a hypothetical example in which there are three segments of customers in the store. It is assumed that in this store, there are many customers that either buy a single beverage or a single beverage and some food staples, following the path shown in red, and other customers that purchase a single loaf of bread, following the path shown in blue.
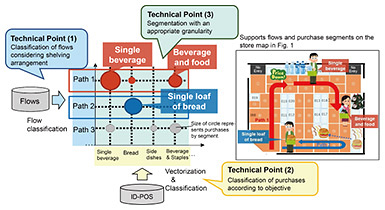
Without executing such segment classification, it is difficult to decide the content and placement of promotions in the store objectively, but if such segmentation is done, it is possible to propose specific measures, such as installing POP or signage along the route shown in red or suggesting purchase of food staples to customers purchasing a single beverage, to increase sale amounts. We developed a technology that automates the segmentation of the combinations of flows and purchases and presents the results to the store manager. To visualize behavior in a store, there are solutions that show customer-location tendencies in the store as a heat map and displaying these tendencies for each product shelf, but they are not segmented in accordance with flows or purchases. The technology we developed (in-store behavior-classification technology) has three components: (1) a flow classifier, (2) a purchase classifier, and (3) segmentation technology for combined flows and purchases (Fig. 2).
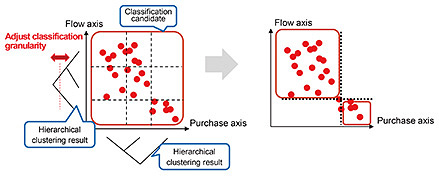
(1) Flow classifier: This component takes in-store flow data as input, computes similarity among flows, groups and classifies similar flows and selects the main flow patterns. Flow data are given as a sequence of areas that each customer passes through, with sequences of varying length, so it is not possible to compute similarity using a simple vector-similarity calculation. There are also constraints such as shelving and aisles in a store, so it is possible that similar flows could be confused with others that are not actually similar if similarity is computed on the basis of only physical distances. To resolve these issues, we applied a method called dynamic time warping (DTW) [1], and used a method based on distance moved within the store to calculate similarity considering the arrangement of shelves and aisles rather than just physical distance. With these methods, we have shown improved accuracy of classification, particularly for short flows that tend to be misclassified easily. (2) Purchase classifier: This component takes purchase data from each customer as input, creates vectors representing the purchases of each customer, groups and classifies similar purchases, and selects the main purchase patterns. When classifying purchases, product-category information already associated with products is frequently used. However, the granularity of such categories varies greatly by managing entity and categories are often focused on the ingredients rather than the customer-purchasing factors needed for sales promotion (e.g.: food staples, side dishes, beverages), so they cannot be used as-is for purchase classification. We found that a characteristic of product categories is whether products tend to be purchased individually or with other products and if with other products, what sort of products. We call this characteristic “how-purchased.” On the basis of this concept, we defined the tendency for product categories to be purchased individually or with other products in terms of a vector that expresses the characteristics of the category and used it in the classification of each purchase. We showed that doing so results in classification results that are close to the results from subjective classification. (3) Segmentation technology for combinations of flows and purchases: This technology combines the results of flow and purchase classification and executes segmentation with an appropriate granularity. For this research, we defined appropriate granularity to mean a segment granularity that results in a strong connection between flows and purchases. To implement this, we carried out hierarchical clustering on the classifications from (1) and (2) then indexed the strength of the connection between flows and purchases using the mutual-information content to identify an appropriate granularity (Fig. 3).
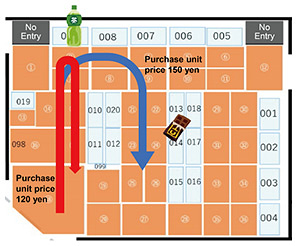
With the technologies introduced thus far, we were able to classify into segments by flow and purchase, as shown on the left in Fig. 2, enabling store managers to consider and implement sales promotions within a store in accordance with each segment. 5. Technology to automatically suggest promotion measures to optimize retail store operationWhen implementing measures to increase sales or improve a store, it is generally easy to identify “who” needs improvement from the results of data analysis, but it is more difficult to get suggestions on “how” improvements should be made. In practice, decisions on measures to take are made based on the store manager’s knowledge and expertise. To address this issue, we proposed an approach in which, for a given targeted segment (intervention group), we identify another group with similar purchasing and behavior tendencies but better characteristics such as more frequent store visits or higher-priced purchases (the preferred group). We then identify measures that will move the intervention group toward the preferred group. For example, suppose, as shown in Fig. 4, that the purchase amount for the flow going directly to the beverages then returns to the entrance (red) is 120 yen, but the amount for the flow going past the snacks in the center (blue) is 150 yen. In this case, if customers on the red flow are guided to the next aisle, we can assume that their purchase amount could also increase. The expected effect of this measure can also be calculated as (no. of intervention group purchases) × (rate of change in the intervention group) × 30 yen (the difference in purchase amount between the intervention and preferred groups).
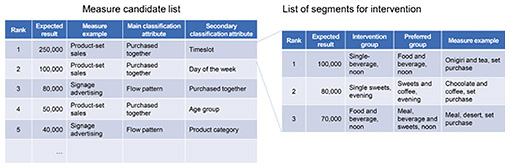
5.1 Data required for this approachThe technologies needed to implement this approach are (1) automatic customer segmentation that selects an appropriate intervention group and preferred group from among the wide range of data available in a smart store, and (2) a technology to compute the expected effect of the measure, which computes the effect that can be expected from the selected intervention group considering characteristics of the preferred group. An outline of these technologies is given below. (1) Automatic customer segmentation: The objective with this technology is to select an intervention group and preferred group that have similar purchasing and behavior tendencies for which a statistically significant and sufficient effect of a measure can be expected. Even if customers and purchases are each partitioned randomly and differences in store-visit frequency or purchase amounts are compared, we would not know whether the differences arose by chance or represent a stable tendency. We used a method for testing the significance of differences between various distributions and computing the degree of difference in distributions between groups to select combinations of segments for which measures can be expected to have a sufficient effect. (2) Expected-effect computation technology: This technology computes the effect that can be expected for a measure when applying a concrete, rule-based measure to the intervention group selected in (1), influencing it toward the preferred group behavior. A feature of this technology is that it defines rules for the attributes needed for various sales-promotion measures then searches for meaningful candidate measures by narrowing down the combinations that include those attributes. 5.2 Procedure for this approachWe explain the procedure for this approach using the example illustrated in Fig. 5 in which possible measures are taken to increase the number of items purchased by customers and the expected results of those measures computed from a store’s purchase and behavior history.
(1) STEP 1: Register rules for measures Measures that can be taken in the store and rules for them are first defined. For example, in a measure to sell products in sets, information on which products can be combined is important, so we create a required attribute for “may be sold together.” For a measure using signage, its location is important, so we create a required attribute for “flow pattern.” (2) STEP 2: Select segment combinations that are significant and effective For the measures and rules registered in STEP 1, execute the following. 1) Generate sets of attributes including those defined as required. 2) For the sets of attributes from 1), use the segmentation technology described above to select intervention and preferred groups that are meaningful and for which a measure will be effective. (3) STEP 3: Compute a specific draft measure and its expected effect For the intervention groups obtained in STEP 2, compute the expected effect as described above and from the results, compute the overall expected effect from all the measures. In Fig. 5, implementing sale of sets of products focusing on the timeslot and the purchased together measures had the highest expected effect, showing that selling sets of products from three specific intervention groups is a possible measure to take. For various candidate measures, specific intervention segments and expected effects are displayed, enabling store managers to select measures with high expected effect. This is the value provided with this technology. We plan to verify the usefulness of this technology in real stores, particularly the appropriateness of the measures suggested and its effect in reducing the amount of work to implement such measures. We will also conduct further studies to implement it practically. 6. Further issues and future prospectsWe described an operation-optimization technology that uses purchase and behavior data obtained in a smart store to efficiently guide the introduction of measures for sales promotion and store improvements. However, looking at in-store behavior is not sufficient for increasing customer visits or purchases. For example, it is difficult to understand information motivating a visit or a purchase from in-store data alone due to factors such as a product becoming fashionable on social media or customers being lured away to a competing store. Thus, it will be necessary to analyze these data together with data from various other sources. We intend to combine in-store purchase and behavior data with external data, analyze these large-scale data efficiently, and study technology to estimate customer incentives for visiting and making purchases in a store. Reference
|
||||