 |
|||||||||||||
|
|
|||||||||||||
|
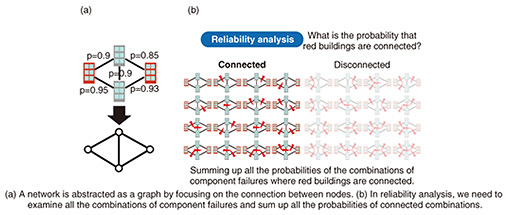
Feature Articles: Exploring the Nature of Humans and Information for Co-creating Human-centered Technologies with AI Vol. 22, No. 11, pp. 23–28, Nov. 2024. https://doi.org/10.53829/ntr202411fa2 Towards Reliable Infrastructures with Compressed ComputationAbstractContemporary society depends on several network infrastructures such as telecommunication and transportation. Analysis of such infrastructures is essential for, e.g., designing high-performance networks and finding vulnerable network components. This analysis often necessitates considering combinations of network components such as roads and optical fibers. However, combinations result in a prohibitive increase in computational time, preventing us from performing the analysis sufficiently in a reasonable time. In this article, I introduce efficient network-analysis algorithms using a decision diagram, which represents an enormous number of combinations in a compressed form, to tackle computationally challenging network-analysis problems. Keywords: network infrastructures, compressed computation, decision diagrams 1. Network-analysis problems and combinationsOur society greatly depends on various infrastructures such as transportation, telecommunication, and electric-power distribution. What are the structural properties of such infrastructures? Highways spread like a mesh throughout Japan, and a core telecommunication network covers Japan through the laying cables. Therefore, modern infrastructures form network structures with many network components such as roads and cables. There are various requirements for these infrastructures to work as bases for our society. For example, traffic jams should be avoided for road networks, and excessive delays and communication outages should be avoided for telecommunication networks. In accordance with these requirements, there are numerical indices for measuring the performance of infrastructures. For example, congestion is a performance index for road and telecommunication networks, and the robustness against component failure is a performance index for telecommunication networks. To develop high-performance, highly reliable infrastructures, it is important to develop algorithms for analyzing such performance indices. Examples of such analyses include congestion analyses to examine what components of the whole network become congested, reliability analyses to examine the robustness against failures and disasters, and vulnerability analysis to detect the weak or critical components of the network. How can we analyze network infrastructures? Since it is difficult for computers to handle components, e.g., roads and cables, as just physical devices, we abstract network infrastructures by focusing on the connection between devices, such as those shown in Fig. 1(a). Every component corresponds to a line (edge) connecting two nodes. Mathematically, this is equivalent to considering undirected graphs in graph theory. By developing network-analysis algorithms for handling the abstracted graphs, we can conduct analyses of the intrinsic structures of networks. However, network-analysis problems are still difficult to solve with computers even after the abstraction. This is because a network infrastructure consists of multiple components, and there are exponentially many combinations of components. If a network consists of N components, the number of possible combinations is 2N, which is the number obtained by multiplying 2 N times. Even if a network consists of only 50 components, the number of possible combinations becomes 1 quadrillion. There are many network-analysis problems that must examine or count such an enormous number of combinations. In basic network reliability analysis, we want to compute the probability that specified nodes are connected via cables. In Fig. 1(b), every node is drawn as a building. There are cases in which some components fail but the specified buildings are still connected via working cables. Thus, in computing the probability, we should consider two cases, work or fail, for every component, examine all the possible combinations of these cases, then add up all the probabilities of combinations where the specified building is connected. Similarly, in congestion analysis, we should examine all possible routes for computing what components are crowded. Since every route is a combination of components, and thus there are an enormous number of routes, the congestion analysis becomes a computationally difficult task.
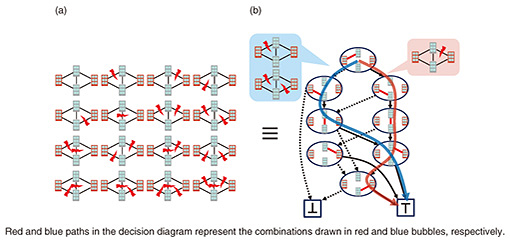
2. Decision diagrams and compressed computationHow do we cope with such an enormous number of combinations? We traditionally handled them by examining or counting only a small number of such combinations. This drastically reduces the number of combinations to examine or count, enabling us to resolve the issue of exponential computational time. However, this approach has a critical drawback in that the analyses become inaccurate because only a small number of combinations are examined. Since infrastructures are used by many people, thus have social importance, rigorous analyses are often needed at the cost of time. This article considers the concept of compressed computation. Within this concept, we retain the combinations in a compressed representation and use it directly for analyses, i.e., computation, without decompressing it. If we can achieve this, we can conduct rigorous analyses because all the combinations are examined. The computational time may also significantly decrease because it may be proportional to the size of compressed representation. One representation to achieve compressed computation is a decision diagram*. A decision diagram represents combinations by a diagram with vertices and arcs, each connecting two vertices. For example, Fig. 2(b) is a decision diagram representing the combinations drawn in Fig. 2(a). All combinations can be obtained by tracing routes from top to bottom. Tracing a solid arc means that the component works, and tracing a dashed arc means that the component fails (see Fig. 2(b)). Solid and dashed arcs generally represent the presence and absence of a component, respectively. Decision diagrams achieve smaller representations by sharing common components of combinations. There are cases in which for a network with around 100 nodes, although there are 1041 combinations of component failures that two buildings are connected, a decision diagram can represent them with only 3000 vertices, which is a substantial compression. We can also conduct various computations, such as optimization and counting, with decision diagrams without decompressing them. With the decision diagram drawn in Fig. 2(b), we can compute the number of combinations where the red buildings are connected even when additional conditions, e.g., a specific component must fail, are imposed. Such a computation can be conducted in time proportional to the number of vertices of the decision diagram. Therefore, decision diagrams can be seen as tools for compressed computation. Decision diagrams have been used for solving various network-analysis problems such as reliability analysis.
We at NTT Communication Science Laboratories have been developing algorithms for more advanced and sophisticated analyses by extending the types of computation and methods for compression within decision-diagram-based compressed computation. This article introduces two network-analysis algorithms developed from such research.
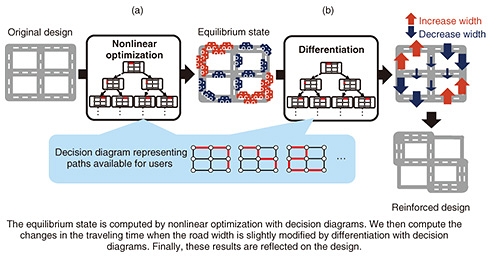
3. Infrastructure analysis by compressed computation3.1 Infrastructure-design algorithm for reducing congestionWithin road and telecommunication networks, when many users’ paths, e.g., the travel routes in road network or the routes of telecommunication network, overlap on a component, this component becomes congested and increases travel time. Thus, the operator of infrastructures wants to decrease the average travel time of users by widening the widths of roads and bandwidth of telecommunication cables to reduce the congestion. However, operators must assume that the users act selfishly when considering infrastructure reinforcement. An example of this is when a traffic jam occurs on highways, every user continues to use highways instead of bypasses if the travel time on highways is still shorter than that on bypasses. What is the best way to reinforce an infrastructure under such a situation? In fact, there are cases in which, by widening some roads’ widths or paving new roads, more users rush to use these roads, which incurs longer traveling time than before. Such a phenomenon is called Braess’s paradox in traffic engineering. Braess’s paradox is closely related to the state called the equilibrium state. When users use an infrastructure selfishly, they switch the path when there is a path with shorter traveling time than the currently used path. After every user repetitively switches the path like the above, all users’ traveling time will eventually become the same, and every user will choose the path with the shortest traveling time at this point. This state is called an equilibrium state. To decrease the average traveling time, we should reduce the congestion within the equilibrium state. However, just widening some roads’ widths or paving new roads results in the change of the equilibrium state, which is the cause of Braess’s paradox. We therefore need to compute the equilibrium state before determining an infrastructure reinforcement that decreases the users’ traveling time. Although the traveling time is the same for all users within the equilibrium state, each user’s path may vary. Therefore, the equilibrium state is formed from a combination of an enormous number of paths, i.e., a combination of combinations. This makes the problem of computing the equilibrium state much more difficult. It is also difficult to determine a reinforcement that reduces the traveling time of the equilibrium state. We developed an infrastructure-design algorithm for determining a reinforcement that decreases the traveling time of the equilibrium state by compressing all the paths that users can choose into a decision diagram and conducting compressed computation with it (Fig. 3).
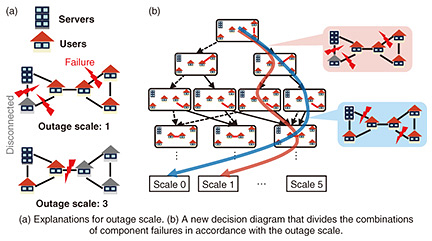
Although computing the equilibrium state is difficult because the result is a combination of combinations, we focus on the fact that it can be solved using a nonlinear optimization problem subject to combinatorial constraints. Solving this optimization problem traditionally requires examining all the paths one by one. However, we proposed an algorithm to solve this nonlinear optimization problem by compressed computation with decision diagrams, enabling us to compute the equilibrium state in a reasonable time [1] (Fig. 3(a)). Our algorithm then computes the differentiation with respect to the road width, i.e., the changes in the equilibrium state and traveling time when the road width is slightly modified, by compressed computation. This reveals the component to reinforce that reduces the average traveling time [2] (Fig. 3(b)). The computational time with this algorithm is proportional to the size of the decision diagram, whereas that of the conventional algorithm is proportional to the number of paths. In the setting of multi-location telecommunication, we can achieve a speed-up of 1025 times by representing 1028 paths as a decision diagram of 10,000 vertices. In the future, we want to resolve various congestion problems such as traffic jams in road networks and delays in telecommunication networks through designing network infrastructures with this algorithm. 3.2 Computing the probability of outage per outage scaleThe components of infrastructures, such as cables, occasionally but inevitably fail because they are physical equipment. Therefore, infrastructures are required to be robust against component failures in addition to being high performance during ordinary times. To assess the robustness against component failures, a reliability analysis such as that shown in Fig. 1(b), i.e., the computation of probability that specific nodes are connected, has traditionally been conducted. With a decision-diagram-based compressed computation, we have conducted exact, i.e., non-approximated, computation of the reliability for real networks with around 200 nodes. However, when an outage occurs, the scale of outage is also an important index. Large-scale outages that affect many users should be less likely to occur than small-scale outages. However, traditional reliability analyses do not take into account the scale of outages. We want to analyze the probability of the occurrence of outages separately for small-scale and large-scale outages. In other words, we want to compute the outage probability for every outage scale. In this problem, we assume that network nodes are categorized into servers and users. We define the outage scale as the number of user nodes that are disconnected from any server, as shown in Fig. 4(a). It should be noted that the outage scale is not proportional to the number of failed components. In the upper example, there are three failed components, but the outage scale, i.e., the number of disconnected users, is only one. In the lower example, only one component failure incurs three users’ outage. We consider the exact computation of such outage probability per outage scale. This enables the operator of the infrastructure to check whether the designed network infrastructure meets a predetermined requirement for the occurrence probability of outage for every scale. However, it is much more difficult to compute the scale-wise outage probability. This is because, in addition to the enormous number of combinations of component failures, we should consider the combinations of the users disconnected from servers. The conventional compressed reliability computation algorithm can calculate the probability that specific users are disconnected from servers if the specified users are fixed. We can compute the scale-wise outage probability by repetitively calculating it for all the combination of disconnected users. However, it is unrealistic because compressed computations are needed 1 quadrillion times for only 50 users. While the conventional decision diagram divides the combinations of component failures in accordance with the occurrence of outages, we developed a decision diagram that divides them in accordance with the outage scale [3], as shown in Fig. 4(b). With this new decision diagram, we developed an algorithm to compute the outage probabilities for all outage scales with only one compressed computation, yielding a substantial speed-up compared with the conventional compressed reliability computation algorithm. For a network with around 50 nodes, e.g., a network where each prefecture in Japan has a node, we can compute the scale-wise outage probability within one second, which is about 100,000 times speed-up compared with the current algorithm. For a network with around 100 nodes, although its difficulty increases 250 times, i.e., around 1 quadrillion times, we can compute the scale-wise outage probability in around one hour, which is a reasonable time.
The proposed algorithm contributes to the highly reliable design of contemporary and future network infrastructures because it enables us to rigorously check whether the designed network meets the scale-wise requirements of outage probabilities. We will develop an algorithm for automatically designing networks where large-scale outages rarely occur by extending this approach. 4. Conclusion and future directionsWe introduced two network-analysis algorithms with compressed computation using decision diagrams. We developed the infrastructure-design algorithm to reduce congestion by using a novel compressed computation that enriches the ability of decision diagrams, while the algorithm for computing the scale-wise outage probability for every outage scale was developed by establishing a new compression method, i.e., a new decision diagram. We also developed various network-analysis algorithms by extending the decision-diagram-based compressed computation, e.g., the computation of the variance of network reliability [4] and that of the expectation of the number of users connected to servers [5]. We will continue to develop efficient and fast algorithms for problems handling an enormous number of combinations, not limited to network-analysis problems. Our algorithms are at the stage of basic research; thus, analyses of currently designing or operating networks have not yet been conducted, although experiments using real network topologies that were released on the web were conducted. Therefore, the next step will be to analyze the currently designing and operating networks with the proposed algorithms and obtain insight for real network infrastructures. References
|
|||||||||||||


