 |
|||||||||||||||||
|
|
|||||||||||||||||
|
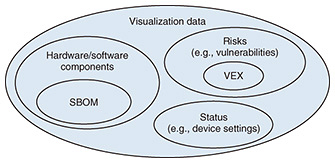
Feature Articles: Reducing Security Risks in Supply Chains by Improving and Utilizing Security Transparency Vol. 22, No. 11, pp. 58–63, Nov. 2024. https://doi.org/10.53829/ntr202411fa8 Enhancing Software Vulnerability Management with Visualization DataAbstractTo use visualization data effectively in software vulnerability management, it is essential to clarify its use cases. This article introduces examples of how visualization data can be used within organizational vulnerability management. Keywords: Security Transparency Consortium, visualization data, SBOM 1. Key practices in managing software vulnerabilities with visualization dataIn organizational software vulnerability management, four actions typically occur: investigating the presence of security issues, considering the impact of vulnerabilities and direction of countermeasures, formulating a countermeasure work plan, and implementing the countermeasures [1]. Investigating the presence of security issues refers to the process of examining acquired vulnerability information to determine whether vulnerabilities exist within the information systems and under what conditions problems may arise. Security operators review publicly available vulnerability information, identify the departments or information systems using software products with relevant vulnerabilities, and pinpoint the areas requiring attention. For instance, a security operator may notify relevant teams if any systems need urgent attention on the basis of information collected through external services providing vulnerability information. Upon receiving such notifications, system administrators report back to the security operator about whether the vulnerabilities pose any risk. The security operator then identifies the areas within the organization affected by the vulnerabilities and proceeds to the next action. If vulnerability information is not appropriately shared both internally and externally, software users cannot implement the necessary countermeasures. The use of visualization data to share this vulnerability information is discussed later. Considering the impact of vulnerabilities and direction of countermeasures involves clarifying the potential impact of the identified issues and evaluating methods for fixing or mitigating them. The number of reported software vulnerabilities has been increasing yearly, with 28,297 vulnerabilities reported to the National Vulnerability Database (NVD) in 2023 [2]. This amounts to more than 70 vulnerabilities being reported daily. While all vulnerabilities in the software used during system development should ideally be addressed, it is not realistic to deal with every reported vulnerability due to the associated workload and costs. Therefore, when addressing vulnerabilities, it is crucial to prioritize countermeasures on the basis of the severity of the impact on the system or organization. Establishing predefined priority indicators within the organization’s security policy, considering the software used and the development style, is an effective approach. In formulating a countermeasure work plan, a plan is created outlining the procedures and timeline for implementing the countermeasures. Factors such as costs and personnel are taken into account and plans for service downtimes and testing are considered. Based on this plan, the implementing the countermeasures action is executed to complete the vulnerability response. Security operators can confirm the completion of a vulnerability response by verifying that the organization has carried out the implementing the countermeasures action. 2. Software vulnerability management using visualization dataIn this section, visualization-data use cases in software vulnerability management are introduced, including the structure of the visualization data. 2.1 Structure of visualization data and its application in vulnerability managementVisualization data refer to data that visualize the structure of software products or systems. As shown in Fig. 1, visualization data encompass a wide range of information, including configuration information (software and hardware components), risk information (such as vulnerability data), and status information (such as actual usage patterns) [3].
This section focuses on the use of two specific formats: a software bill of materials (SBOM), which represents configuration information, and Vulnerability Exploitability eXchange (VEX), which handles vulnerability information, to demonstrate how visualization data can be applied in vulnerability management. An SBOM is a list of components and their associated information included in a software product. The National Telecommunications and Information Administration (NTIA) defines the minimum elements of an SBOM as supplier name, component name, version of the component, dependency relationship, author of SBOM data, timestamp, and other unique identifiers within the categories of Data Fields, which should be considered by organizations implementing SBOMs, as well as automation support and practices and processes [4, 5]. VEX is a machine-readable security advisory used to provide information to user organizations from software vendors and other stakeholders about whether a software product is affected by known vulnerabilities. The U.S. Cybersecurity and Infrastructure Security Agency (CISA) outlines the minimum requirements for information that should be included in a VEX document [6], and in Japan, discussions are underway on using VEX for vulnerability management. As mentioned earlier, four key actions in vulnerability management were introduced. Among these, the use of visualization data in particular is expected to contribute to the actions of investigating the presence of security issues and considering the impact of vulnerabilities and direction of countermeasures. The “Guide of Introduction of Software Bill of Materials (SBOM) for Software Management Ver.2.0 (Draft)” published by the Ministry of Economy, Trade, and Industry (METI) introduces processes such as vulnerability identification, vulnerability response prioritization, information sharing, and vulnerability response [5]. In this context, vulnerability identification refers to the process of identifying vulnerabilities within the software, vulnerability response prioritization involves evaluating vulnerabilities and determining the priority of responses, information sharing refers to sharing vulnerability information both inside and outside the organization, and vulnerability response involves taking some form of action to mitigate the identified vulnerabilities. 2.2 Investigation and analysis of vulnerability impact based on visualization dataWhen using visualization data in vulnerability management, there are two main perspectives: conducting investigation and analysis of vulnerability impact based on visualization data and using visualization data to understand vulnerability information. The former involves the users of the visualization data using elements such as software component information to carry out the vulnerability identification process. The latter refers to users leveraging the vulnerability information embedded within the visualization data to gather the necessary information for the vulnerability response prioritization process. When applying visualization data, it is effective to first determine which use case is more suitable for the organization then explore the appropriate method of utilization. The relationship between these perspectives is illustrated in Table 1.
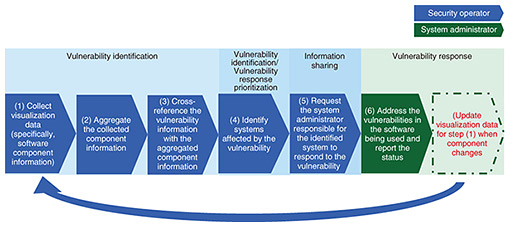
In the following sections, how the elements of visualization data can be applied in each case is introduced. First, let us discuss the use case of conducting investigation and analysis of vulnerability impact based on visualization data. In the vulnerability identification process, the goal is to collect information on the names of software affected by vulnerabilities and the specific versions that are vulnerable then investigate whether these software versions are used within the organization. When using visualization data to identify vulnerabilities, one can cross-reference the collected vulnerability information with software component information, such as an SBOM, which is one of the elements of visualization data. In practice, when security operators within an organization perform this task, it is effective to establish a system that automatically cross-references the vulnerability information with the information listed in the SBOM by consulting services that provide vulnerability information, vulnerability databases, and various software vendor websites. Figure 2 illustrates an example of the sequence of software vulnerability management steps when conducting investigation and analysis of vulnerability impact based on visualization data involving both security operators and system administrators.
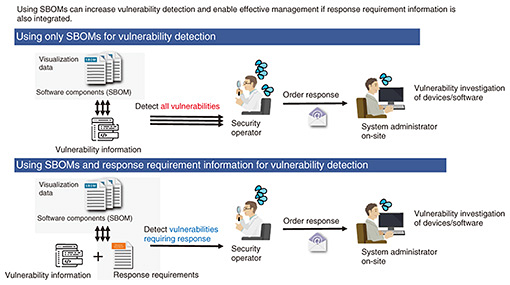
Steps (1) to (4) correspond to the vulnerability identification process, step (5) corresponds to information sharing, and step (6) corresponds to the vulnerability response process. If a large number of vulnerabilities are detected in step (3), it may be necessary to establish priority indicators for responses in step (4) to execute vulnerability response prioritization and limit the scope of step (5) accordingly. Another important consideration when using visualization data is to recognize that after step (6) is executed, the software component information collected in step (1) may need to be updated. An example of a vulnerability response could involve changing the version of a software component. In such a case, if the version information in the component data collected in step (1) differs from the version information after step (6), future vulnerability responses might not be handled appropriately. Therefore, it is crucial to continue updating the component information as software configurations change, even after the initial collection and aggregation of data. The expected benefits of this approach include reducing the labor required for vulnerability identification by the security operator/system administrator and mitigating the residual risk of vulnerabilities. In a proof-of-concept conducted by METI, it was reported that using SBOMs for vulnerability management reduced management labor by approximately 70% compared with traditional manual management methods [7]. 2.3 Understanding vulnerability information using visualization dataNext, let us examine using visualization data to understand vulnerability information, as illustrated in Fig. 3. When applying visualization data to this scenario, it is expected to contribute significantly to the vulnerability response prioritization process.
In this process, vulnerability information is used in conjunction with system security settings and the security controls of access control devices. Software vulnerabilities often become a threat only when specific conditions are met. Information that confirms these conditions (such as settings or designs) needs to be verified by system administrators or users, while security operators must accurately convey the vulnerability information. There are also cases in which a software product may not be affected even if a vulnerability is found. In such cases, the software vendor must disclose this information, and users need to understand and respond appropriately. In Log4Shell (CVE-2021-44228), for example, even after the Log4j vulnerability was disclosed, it was necessary to determine whether the software products in use were affected. In such situations, there is a need for a system that uses visualization data to distribute impact information specific to each software product. Specifically, product vendors would investigate the configuration of software components included in their software products and assess the impact of any vulnerabilities within those components on the overall software product. The results of this investigation would then be published as visualization data. This enables users to determine the impact without needing to directly consult the product vendor. Without the use of visualization data, however, software users would need to confirm with the product vendor whether a vulnerable software component is included in the product and, if so, whether it poses any impact. With the increasing adoption of open source software (OSS), the number of OSS components used in a single software product is also on the rise. When managing vulnerabilities using visualization data, there is a concern that the more software components are used, the greater the number of detected vulnerabilities. In this context, when conducting investigation and analysis of vulnerability impact based on visualization data, verifying whether each software component’s vulnerability in the software product actually requires action could be extremely time-consuming. Therefore, it is considered effective to use visualization data to share information on whether action is needed for software component vulnerabilities for each product, enabling more efficient vulnerability management. 2.4 Exchanging visualization data elements between companiesManaging software vulnerabilities using visualization data involves combining various types of information. Visualization data represent a subset of the information necessary for software vulnerability management, and security operators may need to gather additional information beyond the visualization data when required. In the collection of visualization data, there are elements that are exchanged between organizations and elements that are collected within an organization for use in vulnerability management. Among the visualization data used for vulnerability response prioritization, information such as the security settings of the system on which the software operates or security control information from access control devices such as firewalls should not be shared externally to prevent leakage of sensitive information to attackers. Therefore, it is preferable to collect and use these data within the organization that uses the visualization data, rather than exchanging them between contracting organizations (companies). Among the visualization data used for vulnerability response prioritization, vulnerability information investigated by the software product vendor is necessary for the organization using the software to conduct its own impact assessment. Therefore, this information should be disclosed externally in an appropriate manner. VEX falls under this category. One example under consideration is for software vendors to provide VEX information to a vulnerability database, enabling users to access the information through the database [8]. Among the visualization data used for vulnerability identification, information such as SBOMs should be exchanged between companies to confirm responsibility for vulnerability management within the supply chain. However, issues such as the increased workload for the vendor in verifying vulnerabilities and contractual models that arise from delivering or publishing SBOMs are still under discussion, and no unified policy has been established yet. Therefore, depending on the contracts and development models with suppliers, the first step toward efficient software vulnerability management is to establish a system within the organization that uses visualization data. 3. ConclusionThe use of visualization data, particularly SBOMs, is being widely discussed worldwide. Solutions for creating and managing SBOMs are also beginning to emerge. However, there are still many challenges regarding the distribution of SBOMs and visualization data within the supply chain from the perspective of software vulnerability management. Issues, such as the lack of necessary information in SBOMs for vulnerability identification and the determination of appropriate indicators for vulnerability response prioritization, are still under consideration. References
|
|||||||||||||||||


