|
|||||||||||||||
|
|
|||||||||||||||
       |
Feature Articles: Technologies for Promoting Use of Open Source Software that Contribute to Reducing TCO of IT Platform Vol. 12, No. 6, pp. 14–20, June 2014. https://doi.org/10.53829/ntr201406fa2 HeapStats: Your Dependable Helper for Java Applications, from Development to OperationAbstractHeapStats is an open source software monitoring and analysis tool developed by the NTT Open Source Software Center. HeapStats enables people to monitor detailed runtime information about the heap memory (an area of memory) managed by the Java Virtual Machine with minimal effect on the performance of the Java application. HeapStats helps to resolve problems rapidly when debugging during development, testing, and operation. This article introduces HeapStats and its strengths, application scenarios, and examples of analysis using it. Keywords: Java, fault analysis, system monitoring
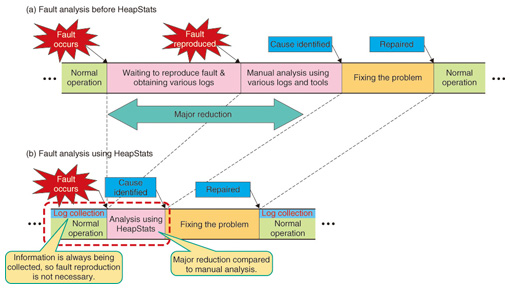
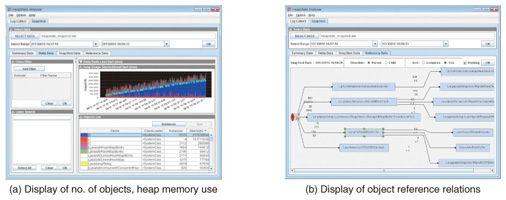
1. IntroductionPart of our technical support related to Java*1 at the NTT Open Source Software (OSS) Center involves handling fault analysis requests from customers. However, for some of these requests, we cannot obtain enough data when the fault occurs to immediately investigate or analyze it. In such cases, we ask the client to recapture the data, although sometimes, such as when the fault occurs infrequently, it can take a very long time to reproduce the fault and obtain the data. In conventional analysis, data such as a heap dump*2 are retrieved. However, this can also place a heavy load on the system, and the output files can be very large, so it is often difficult to obtain a heap dump from an operational system. When it cannot be obtained, a text file called a class histogram must be obtained instead. In such cases, even more manual work is required for analysis, and the information that can be obtained is limited (Fig. 1(a)). For these reasons, at the NTT OSS Center, we have developed a Java Virtual Machine (JVM) monitoring and analysis tool called HeapStats, with the main goal of enabling rapid analysis when a problem in a Java application occurs that causes a fault such as insufficient heap memory. HeapStats operates with low overhead, so it has minimal effect on the performance of the Java application. Moreover, it can continuously obtain detailed information on the internal heap memory state such as heap memory usage by class and reference relationships among classes, and it can analyze faults and display the results graphically. These capabilities enable it to continuously obtain sufficient information to analyze faults and immediately respond when problems occur suddenly, even on an operational system (Fig. 1(b)).
We have published HeapStats as open source software (OSS) in a community called IcedTea. Our goal is to have it used in many projects, obtain feedback from users, and make further improvements [1]. IcedTea is a development community for the OpenJDK package used by many Linux distributors, with participation by many developers and users. Currently, the HeapStats project on IcedTea is operated mainly by three committers*3, who are from the NTT OSS Center.
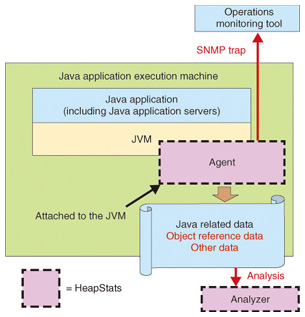
2. HeapStats overviewHeapStats is composed of two programs: the JVM monitoring agent (agent) and the analyzer (Fig. 2). The agent gathers the information needed to analyze faults. It can be invoked easily by adding a start-up option when starting a Java process, and it continuously monitors factors such as heap memory usage and occurrence of deadlocks. It can also alert other operation monitoring tools using Simple Network Management Protocol (SNMP) traps, so it can also be used as a simple monitoring tool. The analyzer is an application that provides a GUI (graphical user interface) displaying the various kinds of JVM information obtained by the agent, and also provides analysis support.
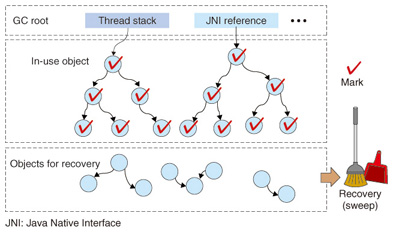
2.1 AgentThe agent collects information related to heap memory. It was built conforming to the JVM garbage collection (GC) implementation as described below in order to minimize the overhead for the application being monitored. When the GC is recovering heap memory from Java objects that are no longer in use, it looks for and marks objects still in use in order to prevent recovery of memory still in use (Fig. 3). The agent interposes a process into the function performing this marking process to obtain a variety of information, so the agent and the GC marking process operate together. To eliminate application programming interface (API) call overhead in doing so, it obtains data by directly referencing the heap memory data addresses needed.
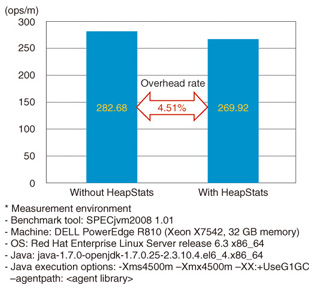
The information gathered by the agent is narrowed down to what is needed for analysis, which keeps the volume of data small compared to that of a heap dump. The information obtained for each GC is output to a log (a snapshot file) immediately, so there is no impact on memory. The agent uses these techniques to obtain the data with low overhead. We used SPECjvm2008 [2], a standard benchmark for measuring the performance of Java runtime environments, to compare scores when using and not using HeapStats. It showed that the overhead was kept to 4.51%*4 (Fig. 4). This allows information to be collected continuously, even on an operating system, which is not possible when using heap dumps.
The agent also gathers a variety of information regarding aspects other than heap memory, for example, server resources. In addition to the information normally gathered (Fig. 5(a)), the agent gathers even more information when an out-of-memory error (OOME) or deadlock occurs in the JVM (Fig. 5(b)). The agent runs on x86 and x86_64 architectures running Linux and Java SE6 or greater, and installation packages are available for Red Hat Enterprise Linux and others.
2.2 AnalyzerThe analyzer displays information related to the snapshot files and server resources collected by the agent. In particular, the information recorded in snapshot files is displayed graphically to aid analysis. A screen with the time sequence of heap memory usage information and the per-class number of objects and heap memory usage are shown in Fig. 6(a). A screen graphically showing the referential relationships for a class object (what classes reference an object of a given class)*5 is indicated in Fig. 6(b). This is often a large amount of information and can be difficult to analyze using conventional heap-dump analysis tools. To simplify the analysis, the analyzer provides functions to narrow the results by a particular class name or to sort them by the number of objects or the heap memory usage per class.
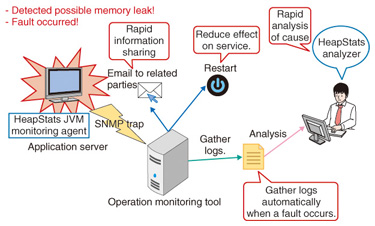
A concrete example of analysis using the analyzer is described below. 3. HeapStats application scenarioTesting and debugging related to heap memory can be done more efficiently by using HeapStats starting with the development stage. Java programs entrust the management of heap memory to the JVM, so they do not have to explicitly release memory. However, if a program unintentionally maintains references to some objects, the JVM cannot release the memory, and the heap memory usage increases, which can lead to running out of free space in heap memory (memory leaks). The heap memory analysis functions of HeapStats are useful for detecting memory leaks early. Normally, memory leaks are discovered during development testing, but if they progress slowly over long periods of time or are triggered by a particular operation, they could manifest during operation as well. Insufficient heap memory can also occur even without a memory leak, such as when the amount of processing exceeds that anticipated during design, or when processing requiring a large amount of heap memory occurs. These can be related to the number of users or an increase in accumulated data, so they can occur after operating for a certain amount of time. Thus, even programs with adequate debugging and testing before release must be monitored for problems that could arise during operation, so HeapStats can be effective in the operational stages as well. A scenario using HeapStats linked to operations monitoring tools through SNMP is shown in Fig. 7. Notifications that predict faults related to the detailed state of heap memory—such as particular classes consuming large amounts of heap memory—are sent to related parties, which enables a rapid response when such faults occur.
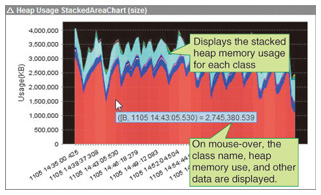
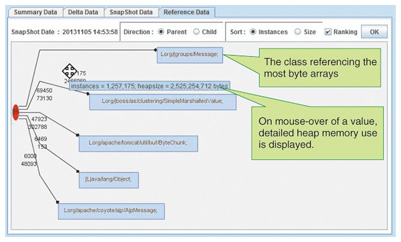
4. Analysis exampleWe next introduce an example of a defect occurring during testing at the NTT OSS Center, which we were able to locate quickly. During testing of a system into which HeapStats had been installed, Major GC*6 events began occurring frequently, causing performance to drop. The heap memory usage stacked area chart (Fig. 8) showed that the program was consistently using quite a large amount of memory, and most of it was allocated to byte arrays. Next, we displayed the class reference relation diagram (Fig. 9) and identified that the class for messages exchanged between application servers for application server redundancy (clustering) was using a large number of byte arrays. From that, we focused our investigation on tuning the settings related to clustering and were able to quickly identify the cause. If we had not used HeapStats, it would have been difficult to understand the reference relations between classes, and we would not have known why byte arrays were being used. Consequently, it would probably have taken much longer to identify the cause.
5. Future developmentIn the future, we will promote HeapStats as an effective analysis tool that can be used to solve problems during development, testing, and operation by introducing it into projects, and to contribute to reducing the total cost of operations. We also hope to add functionality based on user feedback, and to make further quality and performance improvements. Moreover, we would like to integrate it with other OSS analysis tools. References
|
||||||||||||||