|
|||||||||||||||
|
|
|||||||||||||||
       |
Regular Articles Vol. 16, No. 1, pp. 65–70, Jan. 2018. https://doi.org/10.53829/ntr201801ra1 Color Enhancement by Optimizing the Illumination SpectrumAbstractA method is proposed to enhance color saturation while preserving the color appearance of white by controlling the spectral power distribution (SPD) of illumination. We used a color chart to design the SPD of illumination, which enables the enhancement of several colors concurrently. We experimented with a 16-color LED (light-emitting diode) lighting system as a light source, which can modulate the intensity of each color of light. The SPD of illumination is determined by utilizing three color patches of the X-Rite ColorCheckerTM. We evaluated the color checker and multicolor woodblock prints on color enhancement and compared the color distributions of these objects before and after changing the SPD of illumination on a chromaticity diagram. The results showed that the three selected colors were well enhanced while maintaining the color balance and metameric white under daylight illumination. Keywords: color enhancement, spectral power distribution, multiband LED lighting system
1. IntroductionControlling the spectral power distribution (SPD) of illumination can enhance the colors of an object without requiring any image processing. A tunable multi-wavelength light source can control light intensities of all wavelengths and generate light with various SPDs [1]. However, the total output of this kind of lighting system is currently relatively weak and is not suited for practical use. In contrast, the output of light-emitting diodes (LEDs) has been getting stronger recently, and a color tunable lighting system consisting of various LED colors can be used to control the SPD of illumination. In this article, we propose a method to enhance several colors concurrently by changing the SPD of illumination while maintaining the metameric white (explained in the following section) and the color balance. The SPD of illumination is designed based on the spectral reflectance of color patches on a color chart. We conducted experiments to observe the enhancement of colors—before and after applying this methodology—against the color chart and old Japanese woodblock prints (ukiyo-e) as sample objects. 2. Design of SPD of illumination for color enhancementWe explain here the steps involved in designing the SPD of illumination. 2.1 Synthesis and control of illumination using LEDsThe SPD of illumination can be represented as a linear combination of the SPDs of a monochrome LED. Let us consider a lighting system consisting of N-colored LEDs. The SPD of objective illuminant Iobj(λ) is described as:
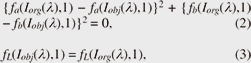
where λ is wavelength and wi and ei(λ) are the weight and SPD of the i th color LED of the lighting system. An object’s color is enhanced by changing the values of w = [w1, ..., wN]. To maintain the color balance of the object under illumination before the SPD of the illumination is changed, let us consider the constraint conditions where the targeted illumination satisfies metameric*1 white. This means that chromaticity*2 values of standard white and its luminance are maintained after the SPD of illumination is changed. These conditions are described as:
where Iorg(λ) is the SPD of the original illumination. Here, fL(I(λ), r(λ)), fa(I(λ), r(λ)), and fb(I(λ), r(λ)) are functions for calculating CIE-Lab*3 values, where I(λ) is the SPD of illumination and r(λ) is the spectral reflectance of an object’s surface. 2.2 Design of SPD of illumination using color chartLet us consider the case in which a target color for enhancement is a color patch whose spectral reflectance is robj(λ). The SPD of the objective illumination Iobj(λ) is obtained by determining weight w = [w1, ..., wN], which fulfills Eqs. (2) and (3) and maximizes ε.
Let the number of target colors be represented as C. Then ε is rewritten as:
When the target colors are blue, green, and red, ε is represented as:
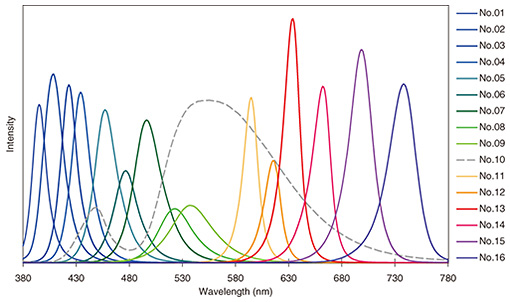
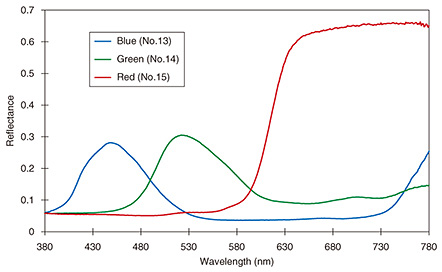
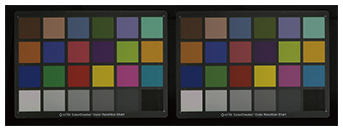
3. ExperimentsWe conducted experiments to evaluate the effectiveness of our method. The experiments and results are described in this section. 3.1 Experimental setupWe experimented with a 16-color LED lighting system (Telelumen Light Replicator, TeleLumen LCC) as the light source. The SPDs of each LED are shown in Fig. 1; the intensity of light for each color can be modulated. We designed the SPD of illumination using three color patches of the X-Rite ColorCheckerTM (no. 13 for blue, no. 14 for green, and no. 15 for red); the spectral reflectance of these patches is shown in Fig. 2.
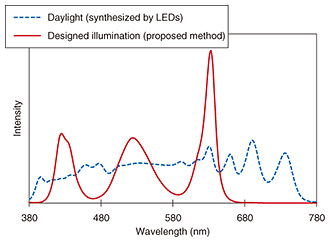
We experimented with synthesizing daylight using the lighting system as the reference illumination. First, we used the color chart to design the SPD of the illumination and focused on enhancing the blue, green, and red colors. The weights of each LED were determined using the generalized reduced gradient method. Next, we evaluated the color enhancement results on a chromaticity diagram using the color chart and several old woodblock prints (ukiyo-e), which were discolored with degraded color saturation. 3.2 Results of designing SPD of illumination and color enhancementThe SPDs of daylight (blue dashed line) and the designed illumination (red solid line) are shown in Fig. 3. The SPD of the designed illumination has three peaks whose center wavelengths are 435, 530, and 634 nm. These center wavelengths correspond to the peak wavelengths of the spectral reflectance of the blue and green patches and to the rising wavelength of the spectral reflectance of the red patch.
Images of the color chart captured under synthesized daylight and under the designed illumination are shown in Fig. 4. A comparison of color patches along the bottom row indicates that the gradation of white to gray is not different after changing the illumination. However, the saturations of other color patches were enhanced after the illumination changes, especially for the blue, green, pink, orange, and red patches. The color balance of the entire image was also maintained after the illumination change.
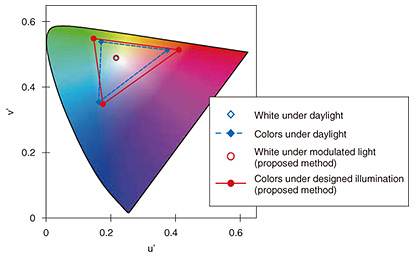
Chromaticity values of white, blue, green, and red patches plotted on the CIE-u’v’ chromaticity diagram*4 are shown in Fig. 5. The blue diamonds and the dashed line represent colors under the illumination before the SPD was changed, and the red circles and solid line represent colors after the illumination was changed. This diagram shows that u’v’ values of white under each kind of illumination are plotted in the same spot; however, the color saturation of the other three color patches is enhanced.
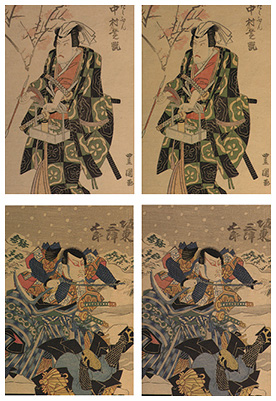
Images of the woodblock print (ukiyo-e) captured under daylight (left) and under the designed illumination (right) are shown in Fig. 6. In the upper images, the reddish and green parts on the clothes under the designed illumination look more vivid than those under daylight. The pink blossoms also look more reddish, and it is easier to distinguish their shapes. Likewise, the reddish and blue-green parts on the bottom prints are more vivid under the designed illumination. Note that the total color balance of these prints is properly maintained through the SPD illumination change, and the color saturation of some areas on these prints was enhanced.
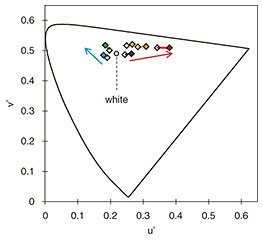
The colors of the blue, green, and reddish parts on these prints plotted on the CIE-u’v’ chromaticity diagram are shown in Fig. 7. The circle represents a white point, and the red and blue arrows represent directions of color shifts that were enhanced by changing the SPD of illumination. The color shifts in the diagram also indicate how much the colors represented in the woodblock prints were enhanced.
4. ConclusionWe proposed a method for enhancing several colors concurrently by changing the SPD of illumination. In our experiments, blue, green, and red patches of the X-Rite ColorCheckerTM were used in designing the illumination, and the designed illumination was synthesized by using a 16-color LED lighting system. We conducted experiments using old Japanese woodblock prints (ukiyo-e) discolored with degraded color saturation, in which we illuminated the prints with the designed light. The results showed that the designed illumination enhanced colors while maintaining the metameric white and the color balance under daylight. References
Trademark notesAll brand names, product names, and company names that appear in this article are trademarks or registered trademarks of their respective owners. |
||||||||||||||