 |
|||||||||
|
|
|||||||||
|
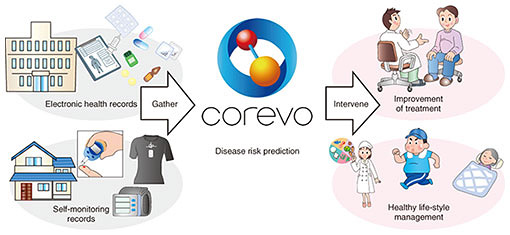
Feature Articles: NTT’s Artificial Intelligence Evolves to Create Novel Services Vol. 16, No. 8, pp. 24–28, Aug. 2018. https://doi.org/10.53829/ntr201808fa4 Artificial Intelligence-based Health Management System: Unequally Spaced Medical Data AnalysisAbstractWe are developing an artificial intelligence (AI)-based health management system that suggests efficient and effective interventions for keeping people healthy based on the potential risk of disease predicted by using AI. We proposed a new feature extraction model for unequally spaced medical data that improves the disease risk prediction. We introduce the model in detail in this article and also describe an application of the model that demonstrates the improved prediction accuracy. Keywords: unequally spaced medical data, diabetes, poor glycemic control 1. Importance of lifestyle-related disease preventionLifestyle-related diseases such as type 2 diabetes, dyslipidemia, and hypertension are defined as diseases largely caused by factors such as an unhealthy life style, lack of physical activity and sleep, and excessive alcohol intake. In Japan, treatment of patients with lifestyle-related diseases accounts for 30% of medical expenses, and the mortality rate from such diseases is 60%. Therefore, prevention of lifestyle-related diseases is one of the most important issues for extending the human health span, which refers to the length of time a person is healthy—not just alive. It is well known that interventions to patients at an early stage of a disease are effective in preventing the onset and progression of the disease, and many intervention programs such as Specific Health Checkups and Specific Health Guidance [1] have been implemented in Japan. However, such programs incur large costs for the government and health insurance providers. Therefore, more efficient and effective interventions for keeping people healthy are needed. 2. Artificial intelligence (AI)-based health management systemWe are developing an AI-based health management system that suggests efficient and effective interventions for keeping people healthy based on their risk of disease predicted using AI. The concept of the system is illustrated in Fig. 1. The system first gathers health data on a user, for example, electronic health records (EHRs) obtained from a clinic and self-monitoring records measured at home. Then the system predicts the risk of each disease using the records and AI. Finally, it prepares a plan for efficient and effective intervention based on the prediction results and suggests the intervention via clinicians, wearable devices, or robots.
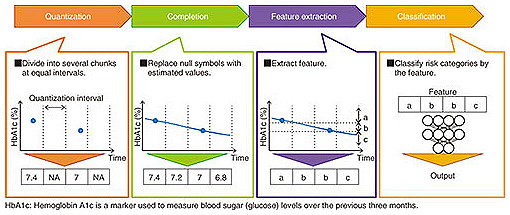
NTT’s accumulated knowledge in data science was used to full advantage in developing the system. For example, NTT, in collaboration with the University of Tokyo Hospital, made use of knowledge in the area of human behavior analysis to address patients’ treatment behavior and successfully predict possible missed scheduled clinical appointments [2]. Some analysis technologies used in the system have grown from basic research in various fields outside medical science. In this article, we introduce a feature extraction model for unequally spaced medical data. This model improves the disease risk prediction of the system using EHRs and self-monitoring records with unequal intervals. We also describe an application where the model improved the prediction accuracy of poor glycemic control of patients with diabetes. 3. Challenge of analyzing unequally spaced medical dataMedical data often consist of unequally spaced values. In general, lab tests are done and prescriptions are issued during clinical visits. The intervals of clinical visits depend on the disease condition and the adherence to treatment and therefore often vary. When users forget to take their self-monitoring records, these intervals also vary. The general method of disease risk prediction using unequally spaced values consists of four processes: quantization, completion, feature extraction, and classification as shown in Fig. 2.
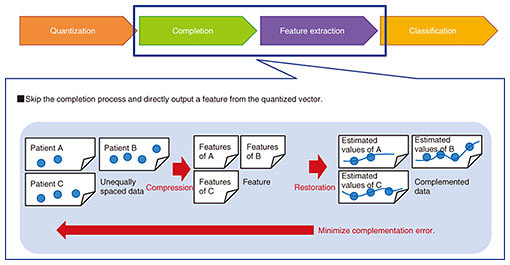
In the quantization process, unequally spaced data are divided into several chunks at equal intervals and converted into a quantized vector. Each chunk that includes values is filled with a representative value such as the average. In contrast, each chunk with no value is filled with a null symbol. For example, when data are divided into one-day intervals, chunks for days with no self-monitoring records are filled with null symbols. In the completion process, each null symbol is replaced with an estimated value by using an interpolation method, and the quantized vector is converted into an estimated equally spaced vector. The linear interpolation is used for estimating values when the trends in values are approximately expressed by a linear function. In the feature extraction process, features representing the estimated equally spaced data are extracted. For example, SAX (symbolic aggregate approximation) is used for transforming time series data into a character sequence. Matrix decomposition is used for transforming a vector into a lower-dimensional vector. In the classification process, a model that receives the features and outputs the disease risk is constructed. There are many classification methods, such as SVM (support vector machine) and logistic regression. However, a problem arises in the sequence from the completion to the feature extraction when using the general method. The feature does not represent the original quantized vector but rather, the estimated equally spaced vector. Any noise and errors in the completion process may be included in the feature, which can result in lower prediction accuracy. Feature extraction from the original quantized vector therefore involves the challenge of analyzing unequally spaced medical data. A method for tackling this challenge is described in the next section. 4. Feature extraction model for unequally spaced medical dataWe developed a feature extraction model that skips over the completion process and directly outputs a feature from the quantized vector, as shown in Fig. 3. The model uses an autoencoder, which is a data compression technique using a neural network where the difference between the input and output vectors measured by a loss function is minimized by an optimizer, and the vector in the middle layer is used as a feature.
The proposed model modified the loss function of the autoencoder. The model minimizes the modified loss function L(w) and learns the parameters w. Here, L(w) is defined as: L(w) = bn íŽ (vn − on(w)), on(w) = ƒ(bn, vn; w), where b is a Boolean vector representing the i-th value of the quantized vector, v is a null symbol (bi = 0) or not (bi = 1), and ƒ is a function by the neural network. The loss function is designed to exclude the null symbols. After the minimization, the vector in the middle layer is used as a feature. The proposed model outputs a feature with a uniform dimension even if the number of null symbols in the quantized vectors varies. 5. Application: prediction of poor glycemic controlType 2 diabetes is one of the most common lifestyle-related diseases, and there are approximately 10 million diabetic patients in Japan. It is vital for diabetic patients to control their blood glucose level to avoid the complications of severe diabetes. We predicted poor glycemic control in patients with diabetes who needed more interventions in collaboration with the University of Tokyo Hospital [3]. We used the feature extraction model for unequally spaced medical data for the prediction. We constructed a prediction model using EHRs from the University of Tokyo Hospital that included over 7000 diabetic patients. The intervals of lab tests varied among patients. The average interval of HbA1c (hemoglobin A1c) tests was 5.9 weeks with a standard deviation of 2.6 weeks. The ROC AUC (area under the receiver operating characteristic curve) of the prediction without the feature extraction model was 0.72. This value increased to 0.80 by using the feature extraction model. We therefore confirmed that the model improved prediction accuracy. 6. Future developmentWe are promoting the development of the AI-based health management system to contribute to efficient and effective interventions that help keep patients healthy. We will improve the core technologies in the system by utilizing standardized medical data stored in the EHR systems of hospitals and measured by wearable devices. We will also take advantage of the knowledge of robotics NTT has accumulated [4] and develop a novel intervention method through networked robots and devices. References
|
|||||||||


